Fig. 6
Download original image
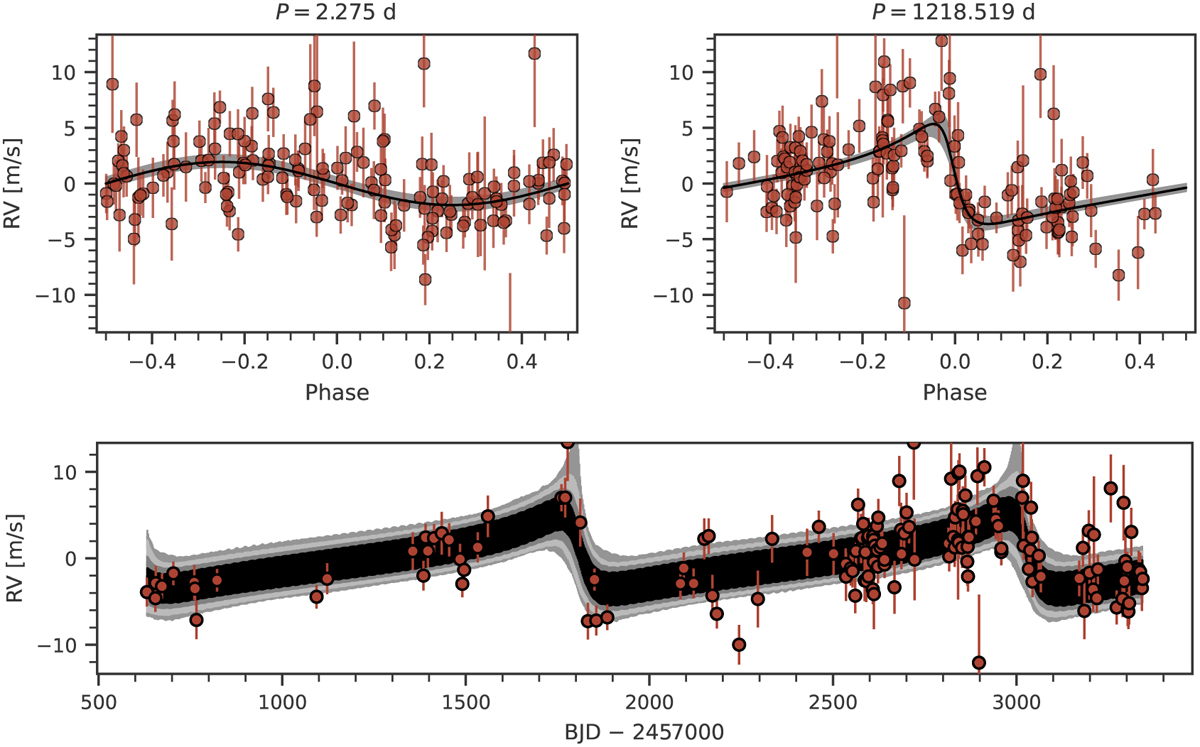
Upper panel: Same as Fig. 2 but for the simultaneous best fit model (= 2P(1218 d-ecc, 2.27 d-circ)) of the two planetary signals around G 192–15. Lower panel: RVs over time for the same model. The black lines show the model based on the parameters listed in Table 3, and the gray shaded areas denote the 68%, 95%, and 99% confidence intervals, respectively. The instrument offset of CARMENES was subtracted from the measurements and the model.
Current usage metrics show cumulative count of Article Views (full-text article views including HTML views, PDF and ePub downloads, according to the available data) and Abstracts Views on Vision4Press platform.
Data correspond to usage on the plateform after 2015. The current usage metrics is available 48-96 hours after online publication and is updated daily on week days.
Initial download of the metrics may take a while.