Fig. B.10
Download original image
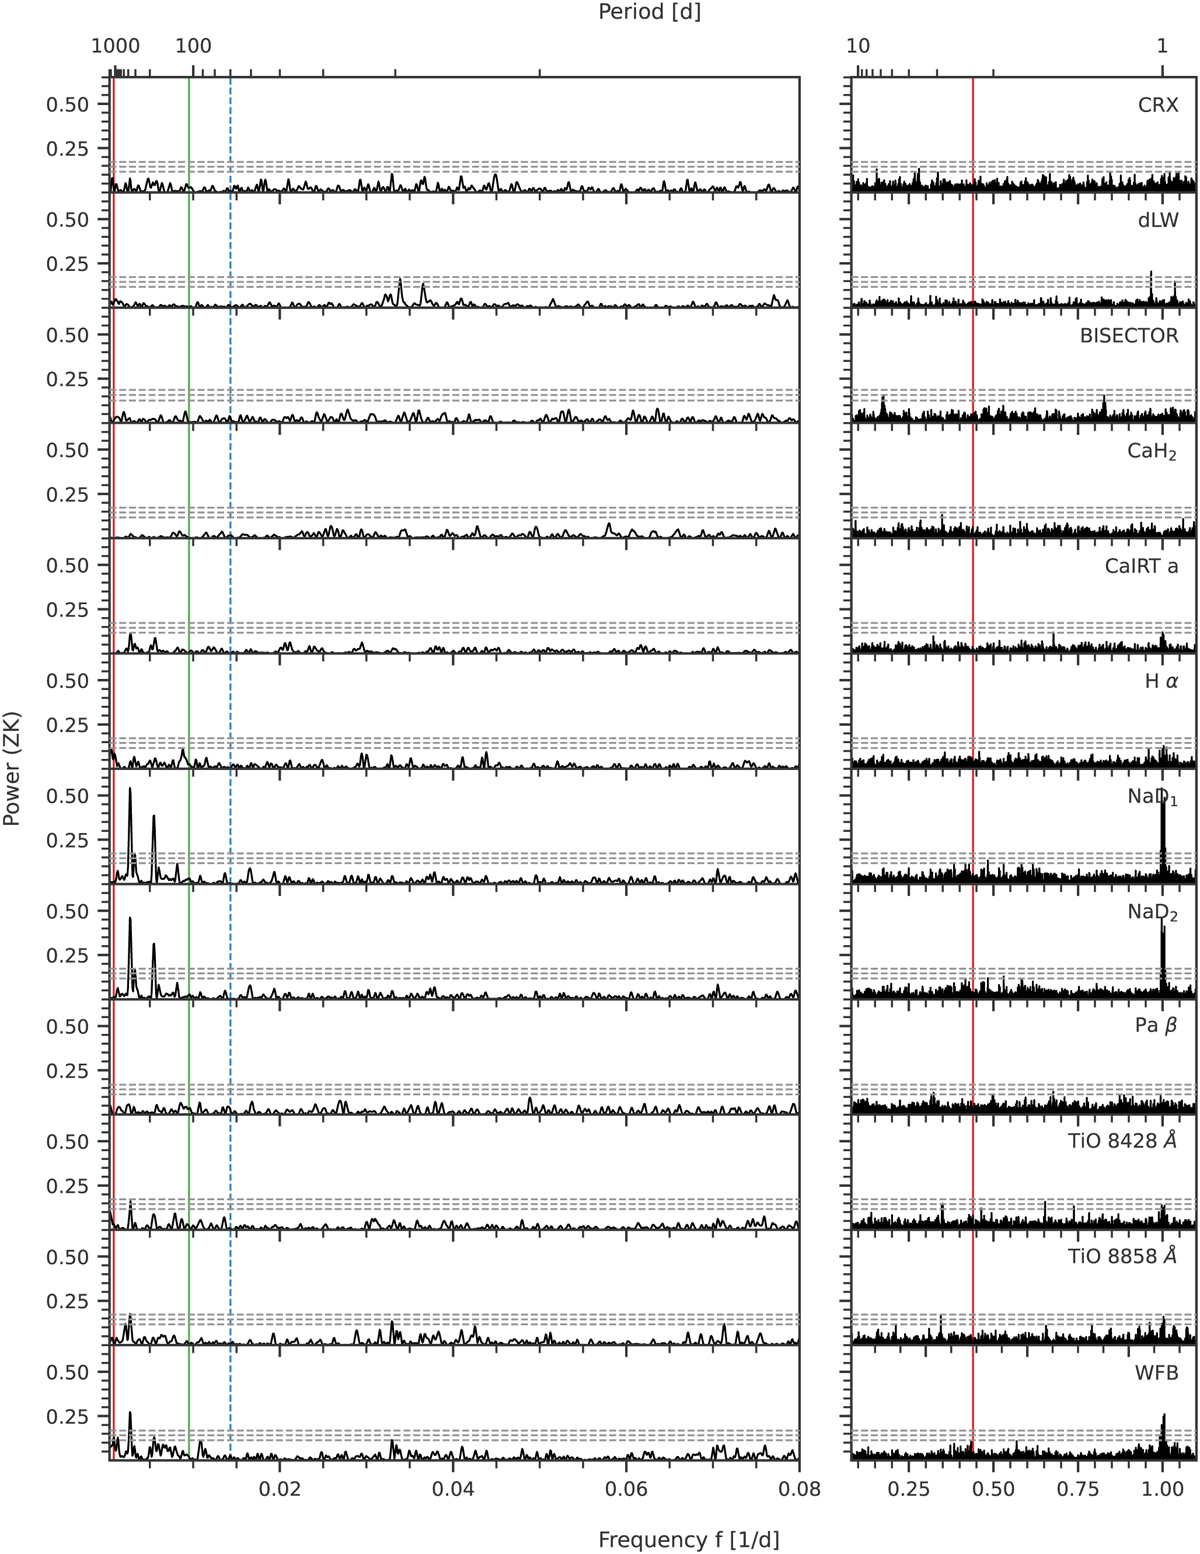
Same as Fig. B.4 but for the activity indicators with significant signals for G 192−15. The periods 2.27 d and 1218.5 d of the planet signals are highlighted by the red solid lines, and the signal found in the residuals at 69.94 d is indicated by the blue dashed line, respectively. The rotation period of 105 d determined by Díez Alonso et al. (2019) is marked by the green solid line.
Current usage metrics show cumulative count of Article Views (full-text article views including HTML views, PDF and ePub downloads, according to the available data) and Abstracts Views on Vision4Press platform.
Data correspond to usage on the plateform after 2015. The current usage metrics is available 48-96 hours after online publication and is updated daily on week days.
Initial download of the metrics may take a while.