Fig. B.9
Download original image
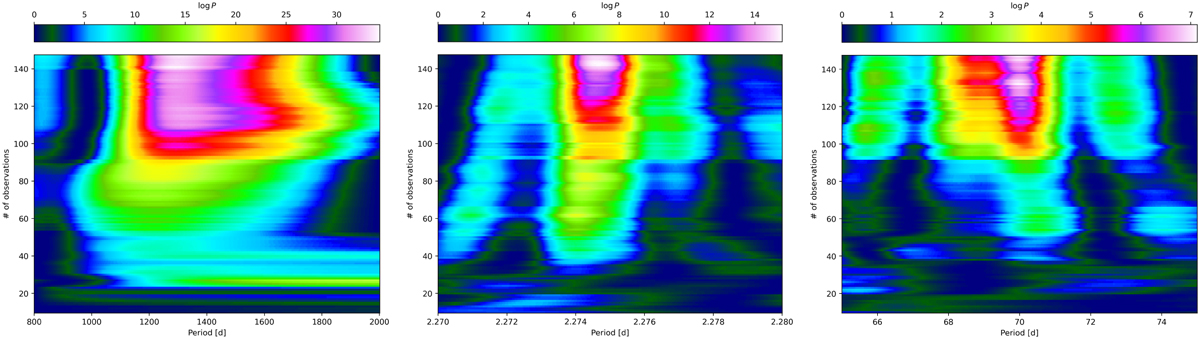
Stacked Bayesian GLS periodograms of the signals detected in the RVs. Left panel: Zoom in on the long-period planetary signal at 1218.5 d. Middle panel: Zoom in on the 2.27 d period signal. Right panel: Zoom in on the 69.94 d variable signal, which appears in the RV residuals after the 2-planet model is subtracted.
Current usage metrics show cumulative count of Article Views (full-text article views including HTML views, PDF and ePub downloads, according to the available data) and Abstracts Views on Vision4Press platform.
Data correspond to usage on the plateform after 2015. The current usage metrics is available 48-96 hours after online publication and is updated daily on week days.
Initial download of the metrics may take a while.