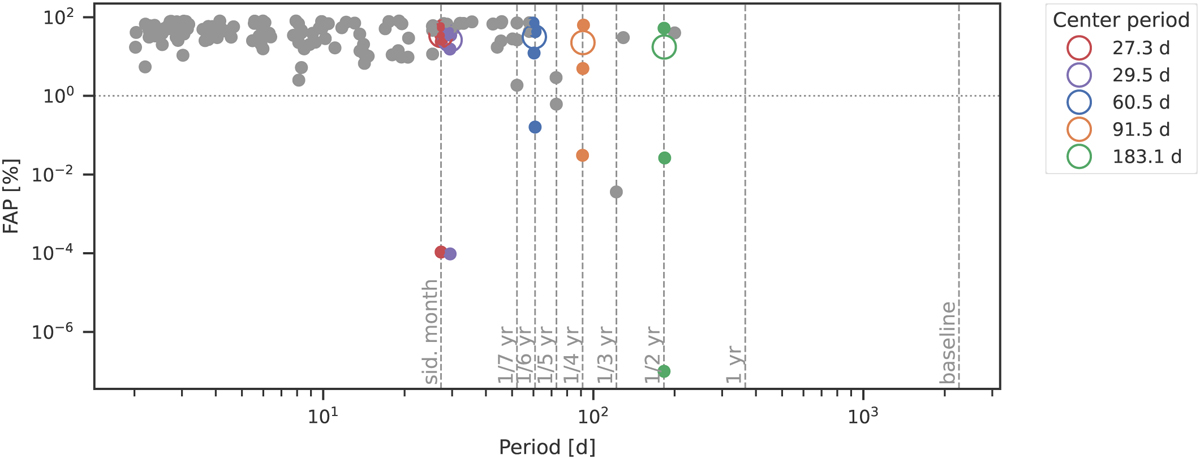
Fig. B.3
Download original image
Diagram of peaks appearing in the GLS periodograms of the activity indicators accessible with CARMENES for G 268−110. For each activity indicator, the GLS periodogram was created and the ten highest-occurring peaks determined. If the FAP of the GLS peak is below 80 %, it is written to a table. This list of peaks is used to run a DBSCAN clustering algorithm. A cluster is a group of peaks with at least 3 members, where the distance to the nearest neighbor is less than the resolution of the GLS.
Current usage metrics show cumulative count of Article Views (full-text article views including HTML views, PDF and ePub downloads, according to the available data) and Abstracts Views on Vision4Press platform.
Data correspond to usage on the plateform after 2015. The current usage metrics is available 48-96 hours after online publication and is updated daily on week days.
Initial download of the metrics may take a while.