Fig. 12
Download original image
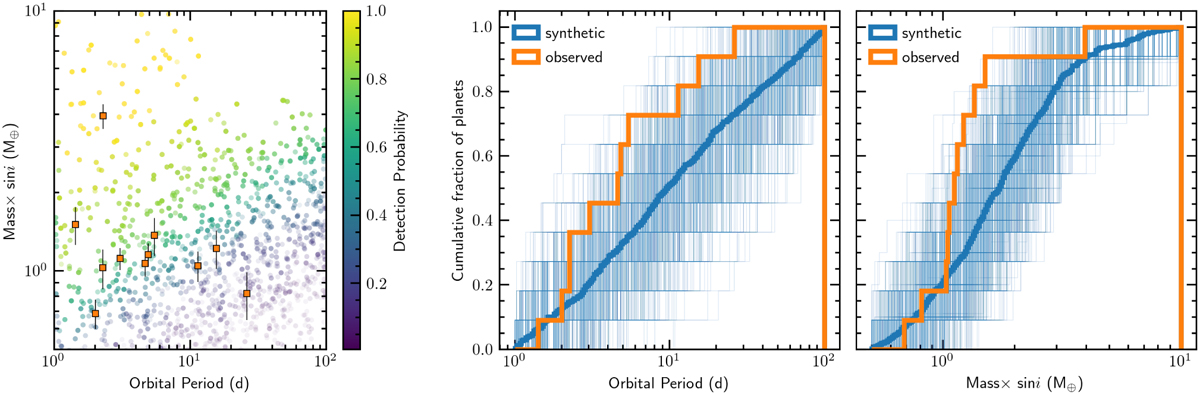
Planet detection statistics of observed planets compared with mock detections based on the synthetic planet population by Burn et al. (2021). Included are all planets with orbital periods of 1–100 d and with minimum masses of 0.5–10 M⊕. The left panel shows the Mpl sin i of the observed (orange squares) and synthetic (circles) planets against orbital periods. The transparency and color of the synthetic data are scaled by detection probability. The cumulative distribution of the observed and synthetic Ppl (middle) and Mpl sin i (right) is shown. For the synthetic data, we show with transparent lines 1000 random draws of 11 planets to visualize the expected spread.
Current usage metrics show cumulative count of Article Views (full-text article views including HTML views, PDF and ePub downloads, according to the available data) and Abstracts Views on Vision4Press platform.
Data correspond to usage on the plateform after 2015. The current usage metrics is available 48-96 hours after online publication and is updated daily on week days.
Initial download of the metrics may take a while.