Fig. 9.
Download original image
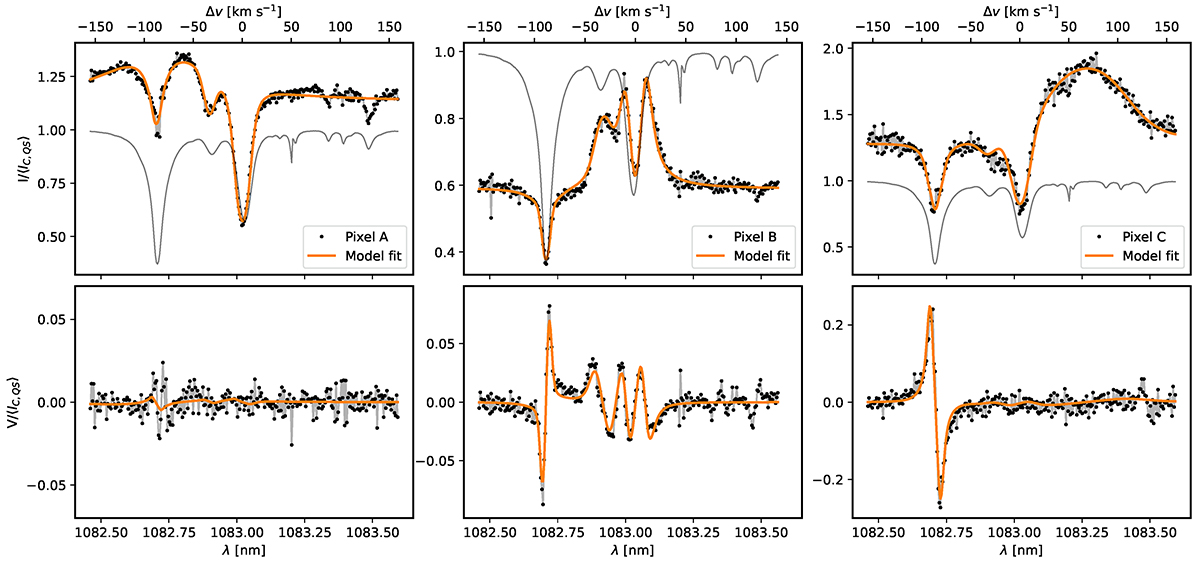
Inversion results for the three selected pixels with emission in the He I 1083 nm line. The columns show the results for pixels A (left), B (middle), and C (right). The top row shows Stokes I; the bottom row Stokes V. Black-filled circles represent the observations, the orange solid lines are the best-fit profiles. The thin gray curve represents an average of a relatively quiet part of the FOV.
Current usage metrics show cumulative count of Article Views (full-text article views including HTML views, PDF and ePub downloads, according to the available data) and Abstracts Views on Vision4Press platform.
Data correspond to usage on the plateform after 2015. The current usage metrics is available 48-96 hours after online publication and is updated daily on week days.
Initial download of the metrics may take a while.