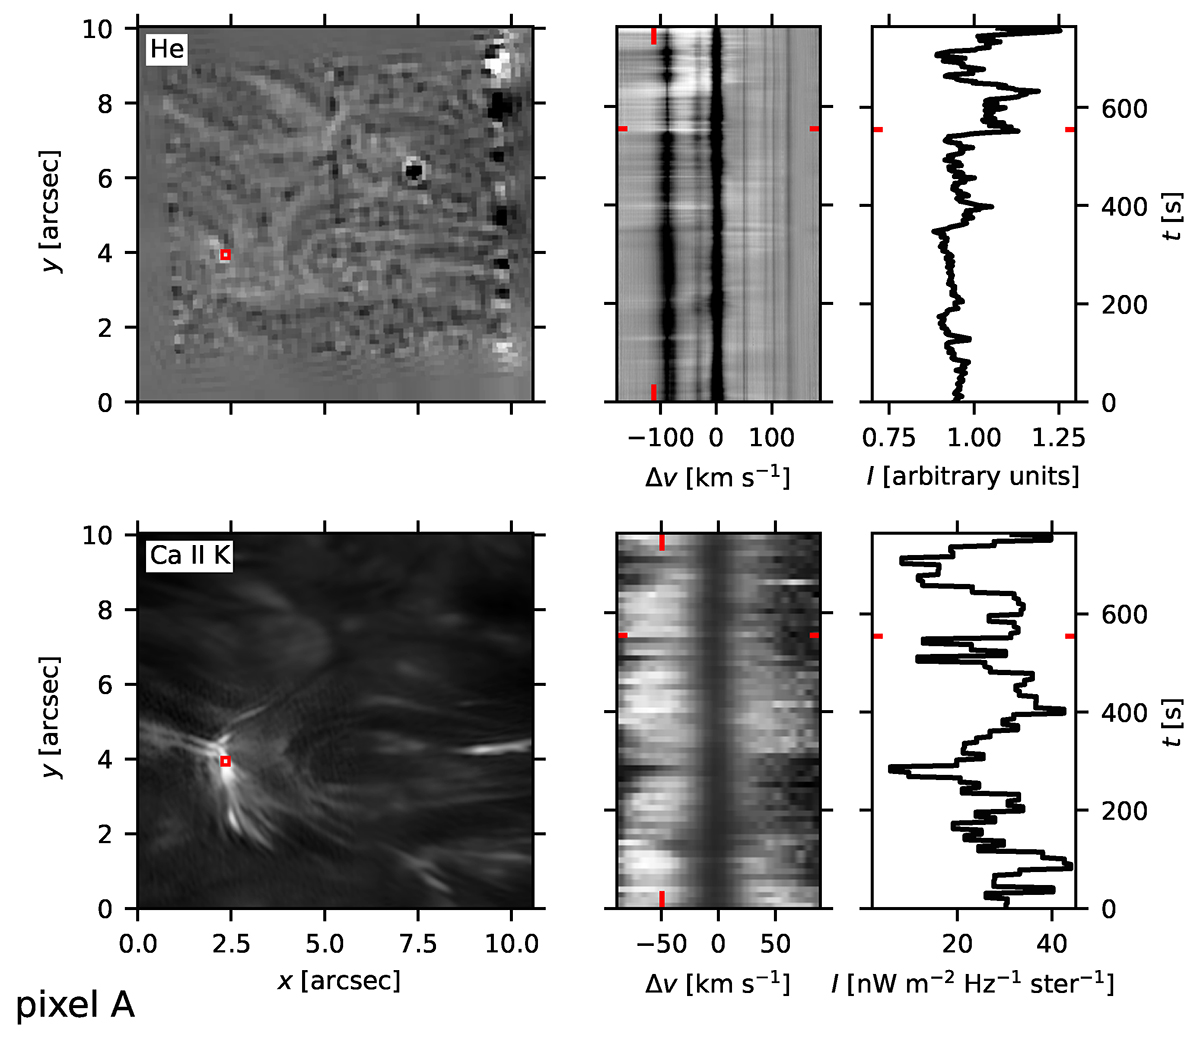
Fig. 6.
Download original image
Emission in pixel A. Upper left: image of the scaled intensity Iλ(x, y, t)/Icont(x, y, t) in He I 1083 nm. Upper-middle: λt-slice of the scaled intensity at the location of the red square in the image. The red tick marks indicate the wavelength and time of the image. Upper right: light curve at the spatial location indicated by the square and the wavelength indicated by the tick marks. The bottom row shows the same for Ca II K, except that the image in the lower-left panel shows Iλ, i.e., it is not scaled to the local continuum intensity.
Current usage metrics show cumulative count of Article Views (full-text article views including HTML views, PDF and ePub downloads, according to the available data) and Abstracts Views on Vision4Press platform.
Data correspond to usage on the plateform after 2015. The current usage metrics is available 48-96 hours after online publication and is updated daily on week days.
Initial download of the metrics may take a while.