Fig. 5.
Download original image
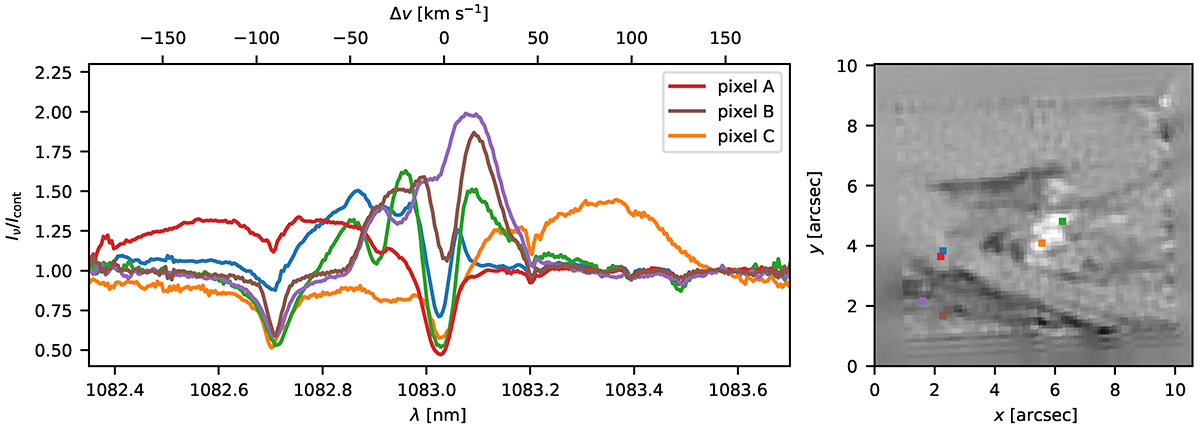
Example He I 1083 nm line profiles that show emission. Left: line profiles. Right: local continuum normalized intensity in the red wing of He I 1083 nm, with the locations of the profiles left indicated with squares of the same color as the profile. The line profiles are taken from the entire time series, not just from the timestep shown in the right-hand panel. The labeled line profiles are discussed in Sects. 5.4–5.6.
Current usage metrics show cumulative count of Article Views (full-text article views including HTML views, PDF and ePub downloads, according to the available data) and Abstracts Views on Vision4Press platform.
Data correspond to usage on the plateform after 2015. The current usage metrics is available 48-96 hours after online publication and is updated daily on week days.
Initial download of the metrics may take a while.