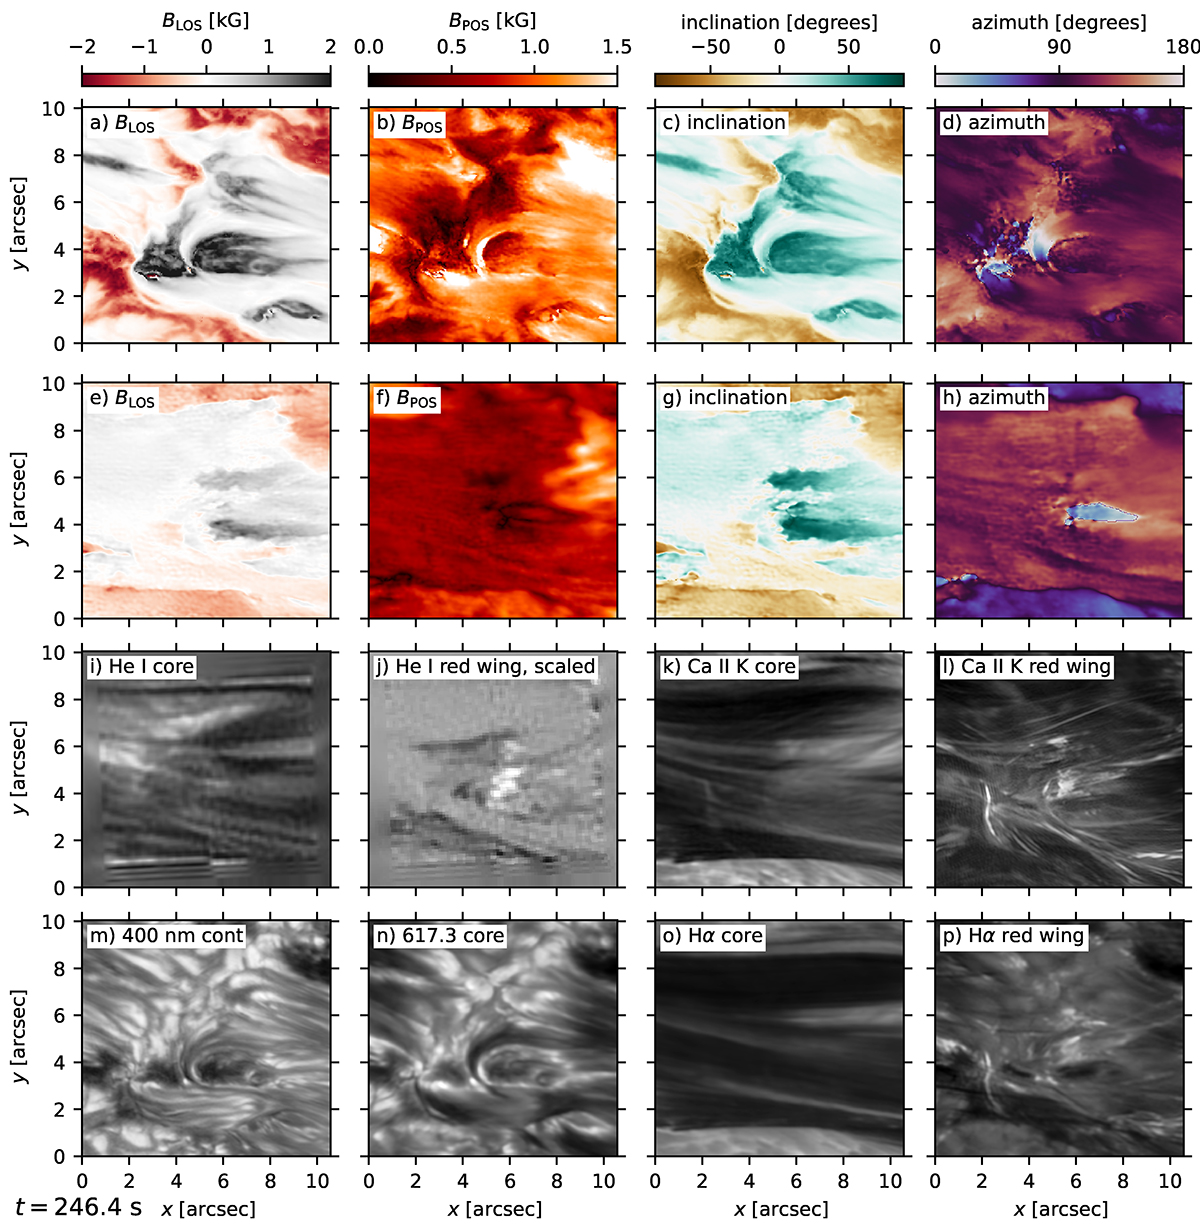
Fig. 4.
Download original image
Overview of the HeSP FOV at 246 s after the start of the observations. First row (a–d): magnetic field in the photosphere as determined from a Milne-Eddington inversion of the Fe I 617.3 nm recorded by CRISP. Second row: magnetic field in the chromosphere as determined from the weak-field approximation in the Ca II 854.2 nm (also CRISP data). Bottom two rows: intensity images at various wavelengths. The Hα red wing image is at Δλ = +45 km s−1 from the nominal line core, the Ca II K red wing image at Δλ = +36 km s−1. Panel j shows the intensity normalized to the local continuum intensity I(x, y, λ)/Icont(x, y), the other panels show the unscaled intensity I(x, y, λ). A movie of this figure showing the entire time series is available online.
Current usage metrics show cumulative count of Article Views (full-text article views including HTML views, PDF and ePub downloads, according to the available data) and Abstracts Views on Vision4Press platform.
Data correspond to usage on the plateform after 2015. The current usage metrics is available 48-96 hours after online publication and is updated daily on week days.
Initial download of the metrics may take a while.