Fig. 2.
Download original image
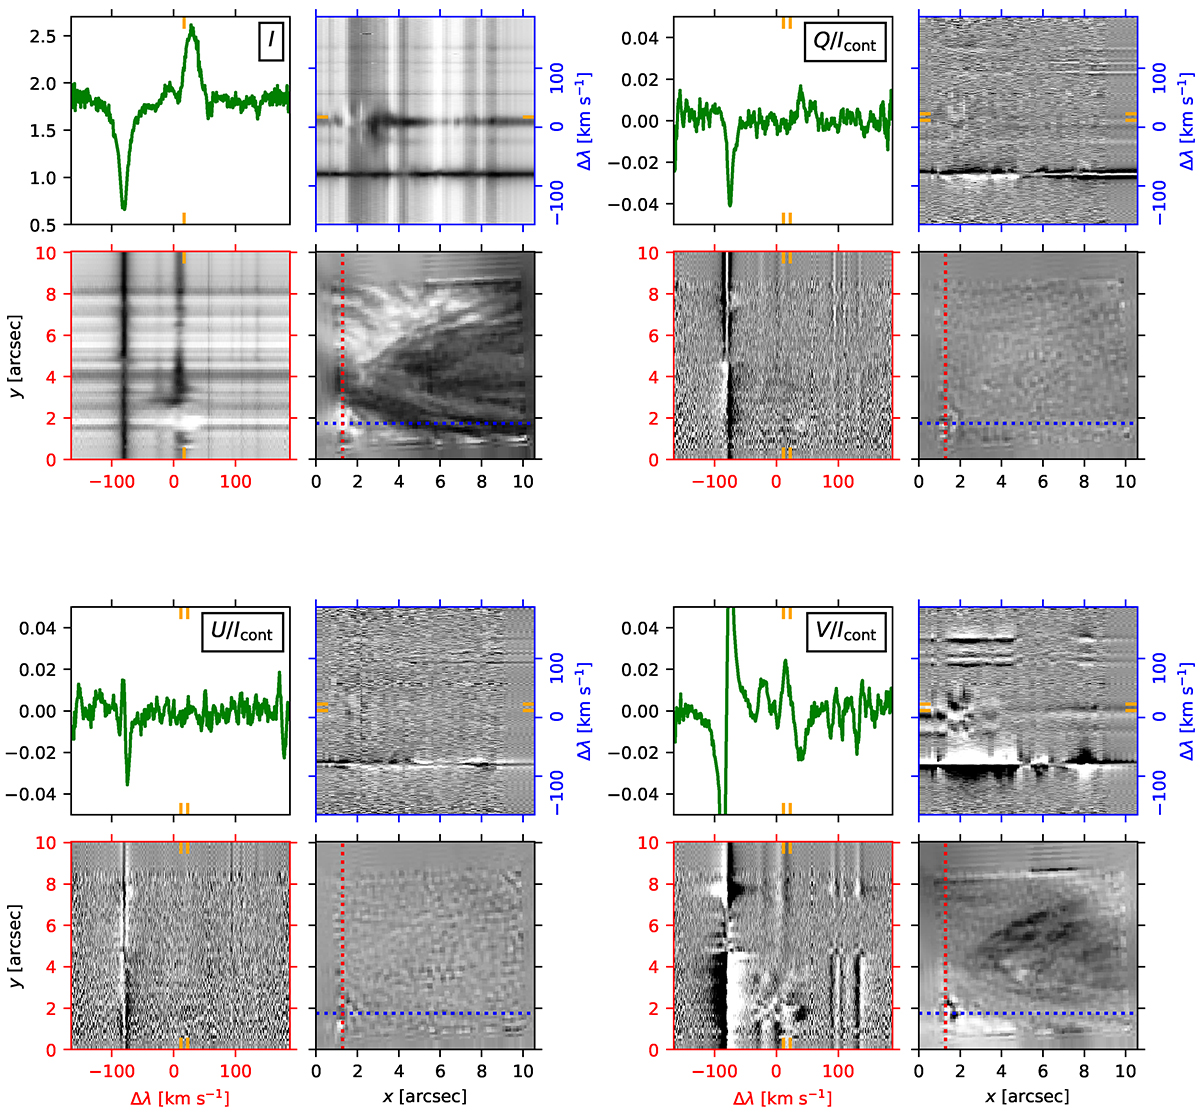
Example HeSP snapshot, at 31 s after the start of the observations. The four groups of four panels display Stokes I (upper left), Q (upper right), U (lower left), and V (lower right). Each group consists of four subpanels, showing an example line profile (upper left), an xλ-slice (upper right), a λy-slice (lower left) and an xy-image (lower right). The locations of the xλ and λy-slices are indicated with blue and red dotted lines in the image, and their intersection is the location for which the line profile is shown. The wavelength of the Stokes Ixy-image in the lower-right is indicated with the orange tick marks in the Stokes I line profile in the upper-left. The Q, U, and V images are wavelength averages, with the average taken over the interval indicated by the orange ticks in the respective frames. The Stokes I intensity is given in arbitrary units. The wavelength axes are specified in units of Doppler velocity relative to λ = 1083.0 nm. An animated version of the figure is available online.
Current usage metrics show cumulative count of Article Views (full-text article views including HTML views, PDF and ePub downloads, according to the available data) and Abstracts Views on Vision4Press platform.
Data correspond to usage on the plateform after 2015. The current usage metrics is available 48-96 hours after online publication and is updated daily on week days.
Initial download of the metrics may take a while.