Open Access
Fig. A.1.
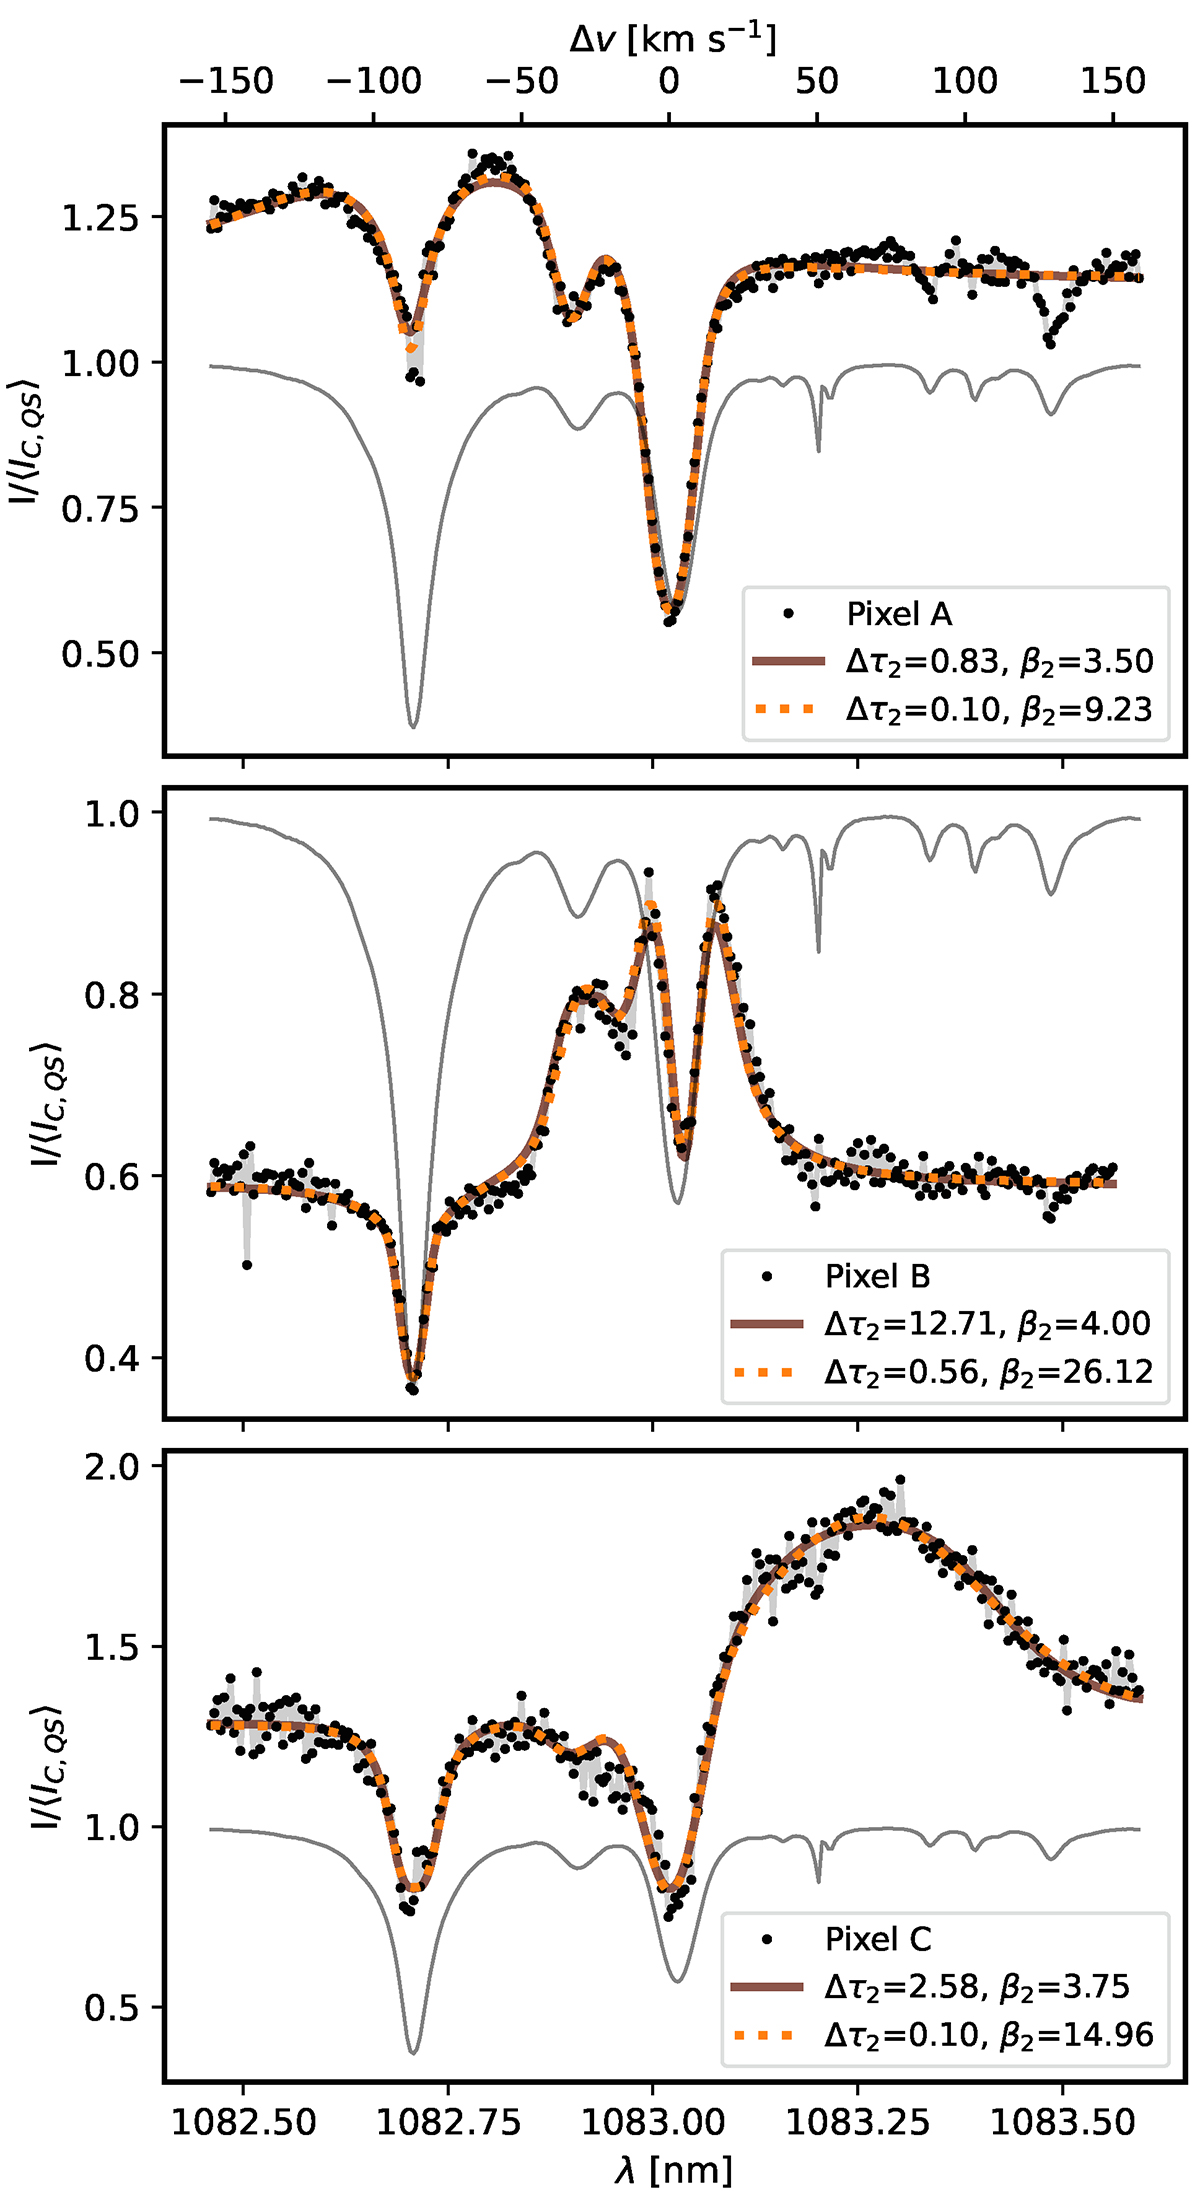
Download original image
Degeneracy between the scaling factor β and the optical depth Δτ. The figure shows the intensity profiles for the three selected pixels, with two models for each pixel, one with low β and high Δτ, and one with high β and low Δτ. The grey curve is a nearby quiet Sun spectrum.
Current usage metrics show cumulative count of Article Views (full-text article views including HTML views, PDF and ePub downloads, according to the available data) and Abstracts Views on Vision4Press platform.
Data correspond to usage on the plateform after 2015. The current usage metrics is available 48-96 hours after online publication and is updated daily on week days.
Initial download of the metrics may take a while.