Fig. 11.
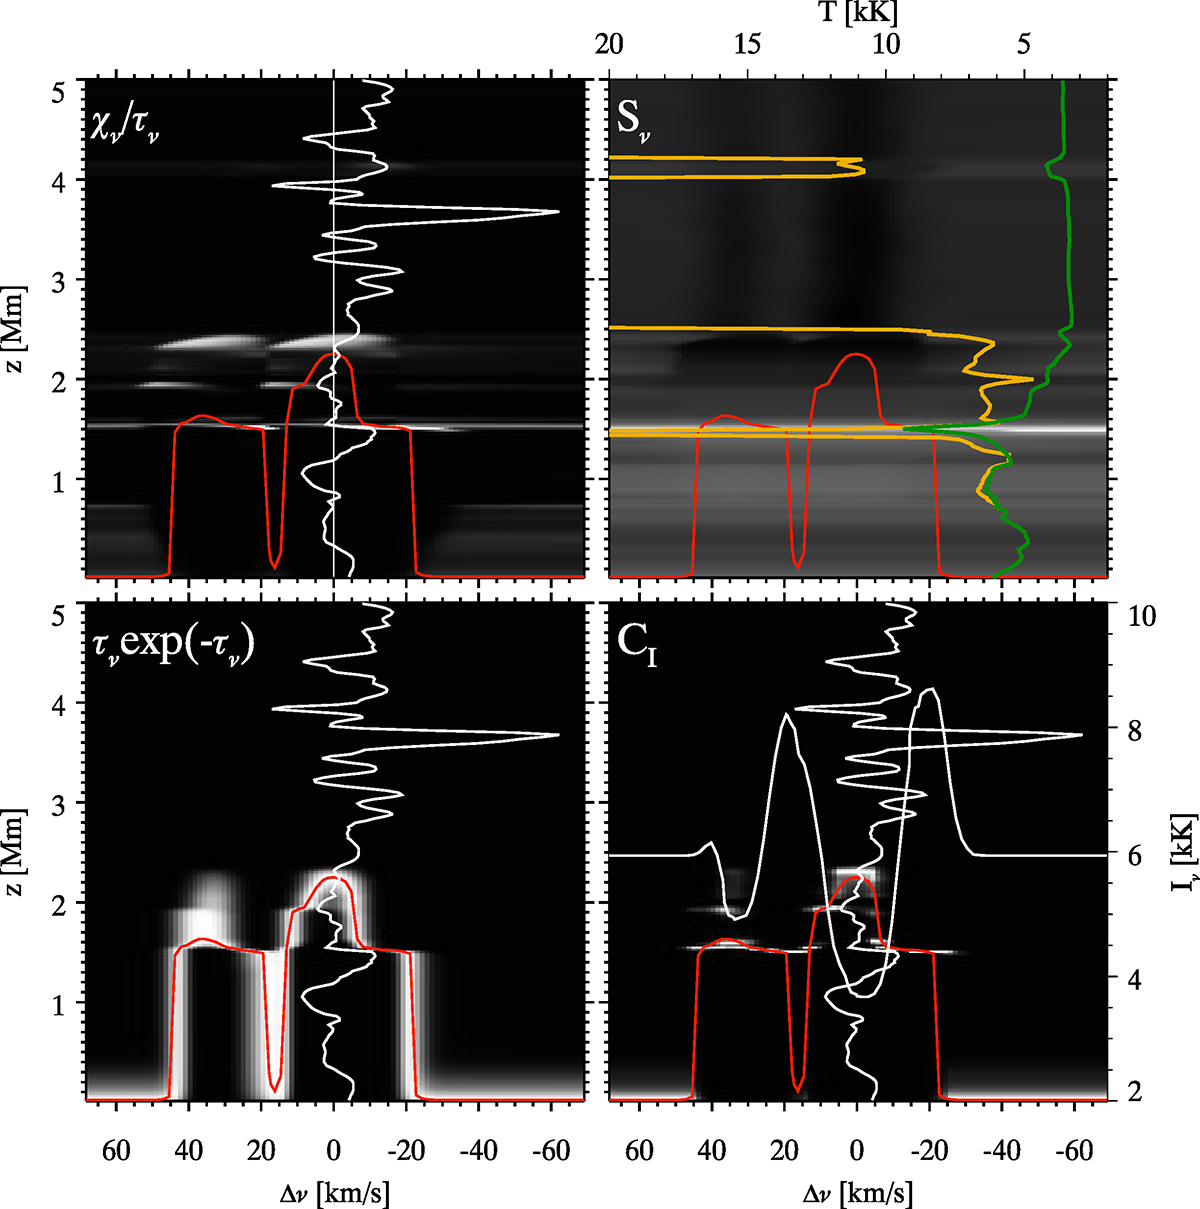
Download original image
Four-panel formation diagram of the pixel marked in red in the bottom row of Fig. 10. Top left: Opacity χν divided by optical depth τν. The red curve is the height optical depth is unity, the white vertical line marks Δν = 0 and the white curve is the vertical velocity as a function of height. Top right: total source function. The green curve shows the line source function, the orange curve the temperature. Bottom left: τνexp−τν, which peaks at τν = 1. Bottom right: the contribution function χνSνexp−τν. The white curve shows the emergent line profile in temperature units, with a scale on the right.
Current usage metrics show cumulative count of Article Views (full-text article views including HTML views, PDF and ePub downloads, according to the available data) and Abstracts Views on Vision4Press platform.
Data correspond to usage on the plateform after 2015. The current usage metrics is available 48-96 hours after online publication and is updated daily on week days.
Initial download of the metrics may take a while.