Fig. 10.
Download original image
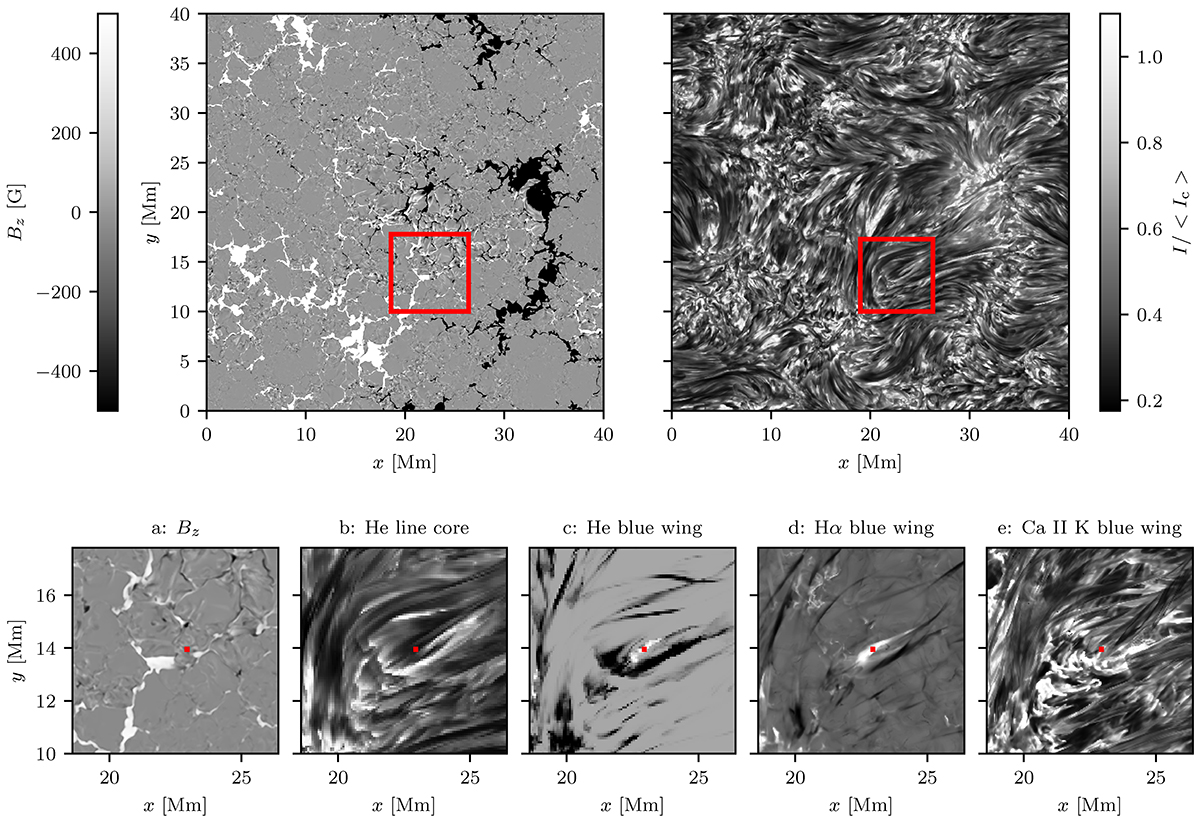
Simulation data. Top row: Vertical component of the magnetic field at z = 0 km and emergent intensity at the nominal line core of the strong component of the He I 1083 nm line. Bottom row: zoom in of the region inside the red square in the top row. Panel a: Vertical component of the photospheric magnetic field at z = 0 km; panel b: emergent intensity at the nominal line core of the strong component of the He I 1083 nm.; panel c: local continuum scaled intensity of the He I 1083 nm at a Doppler shift of −18 km s−1; panel d: Hα intensity at a Doppler shift of −33 km s−1; panel e: Ca II K intensity at a Doppler shift of −8 km s−1. The pixel marked with the filled red square is analyzed in Fig. 11.
Current usage metrics show cumulative count of Article Views (full-text article views including HTML views, PDF and ePub downloads, according to the available data) and Abstracts Views on Vision4Press platform.
Data correspond to usage on the plateform after 2015. The current usage metrics is available 48-96 hours after online publication and is updated daily on week days.
Initial download of the metrics may take a while.