Fig. 1.
Download original image
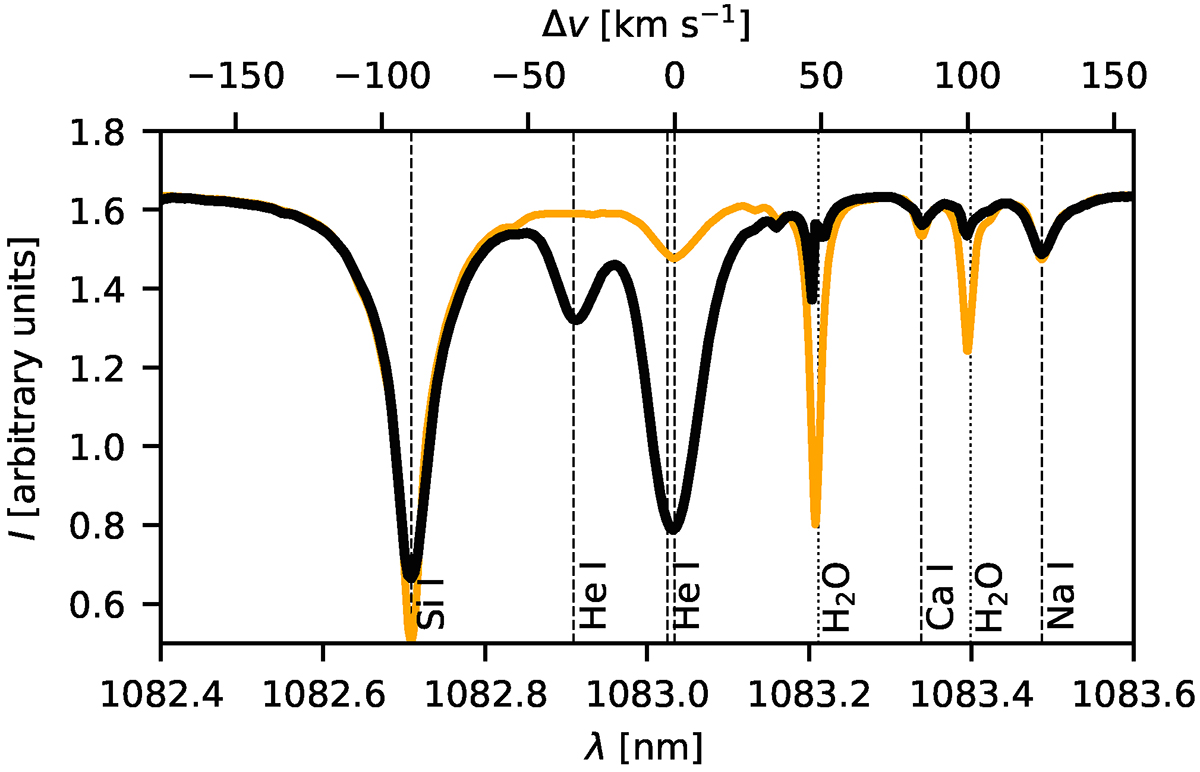
Average spectrum and most important spectral lines in the HeSP observations. Black: spatially and temporally averaged HeSP observations. Orange: Atlas profile from Neckel & Labs (1984), arbitrarily scaled to match the continuum of the HeSP data. Solar spectral lines are indicated with dashed vertical lines and telluric water lines with dotted lines.
Current usage metrics show cumulative count of Article Views (full-text article views including HTML views, PDF and ePub downloads, according to the available data) and Abstracts Views on Vision4Press platform.
Data correspond to usage on the plateform after 2015. The current usage metrics is available 48-96 hours after online publication and is updated daily on week days.
Initial download of the metrics may take a while.