Open Access
Fig. 3.
Download original image
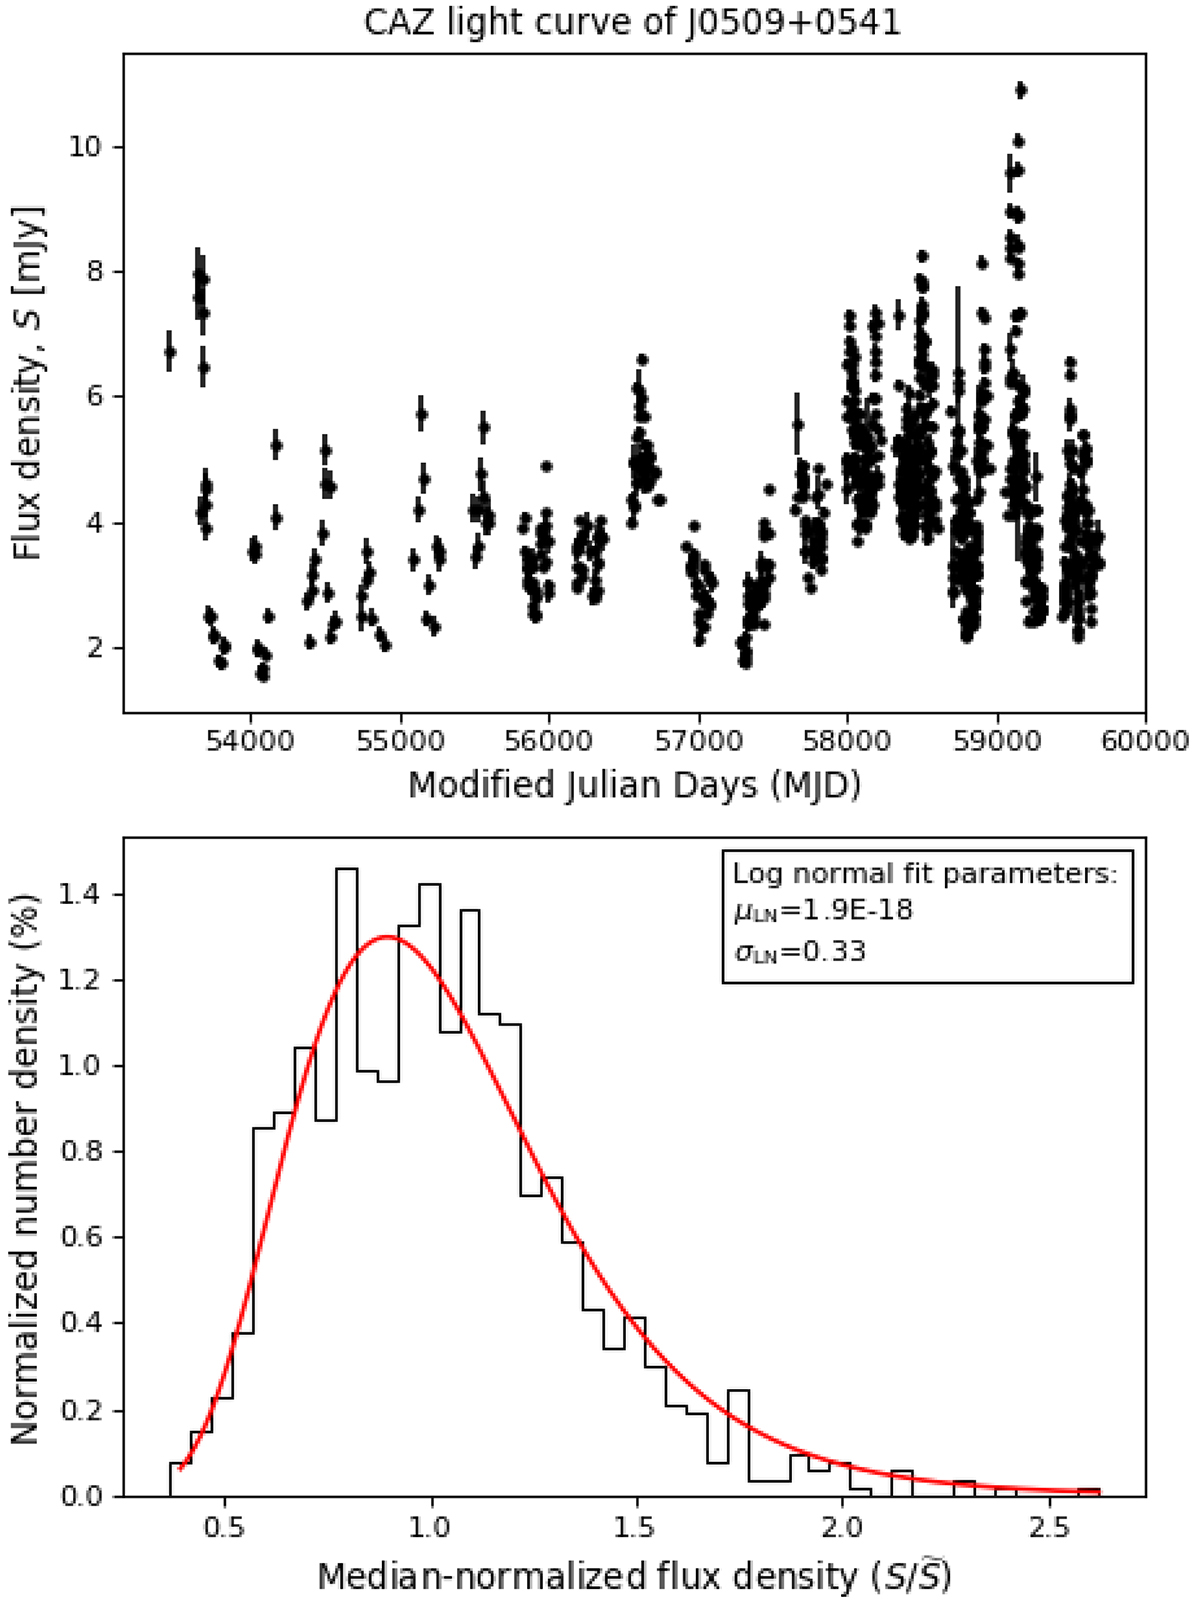
CAZ optical light curve of the blazar J0509+0541 (also known as TXS 0506+056). Top: CAZ light curve. Bottom: Corresponding median-normalized flux density (![]() ) distribution and its best-fit lognormal distribution (shown as the red curve with the parameters μLN ≈ 10−18 and σLN = 0.33).
) distribution and its best-fit lognormal distribution (shown as the red curve with the parameters μLN ≈ 10−18 and σLN = 0.33).
Current usage metrics show cumulative count of Article Views (full-text article views including HTML views, PDF and ePub downloads, according to the available data) and Abstracts Views on Vision4Press platform.
Data correspond to usage on the plateform after 2015. The current usage metrics is available 48-96 hours after online publication and is updated daily on week days.
Initial download of the metrics may take a while.