Fig. 1.
Download original image
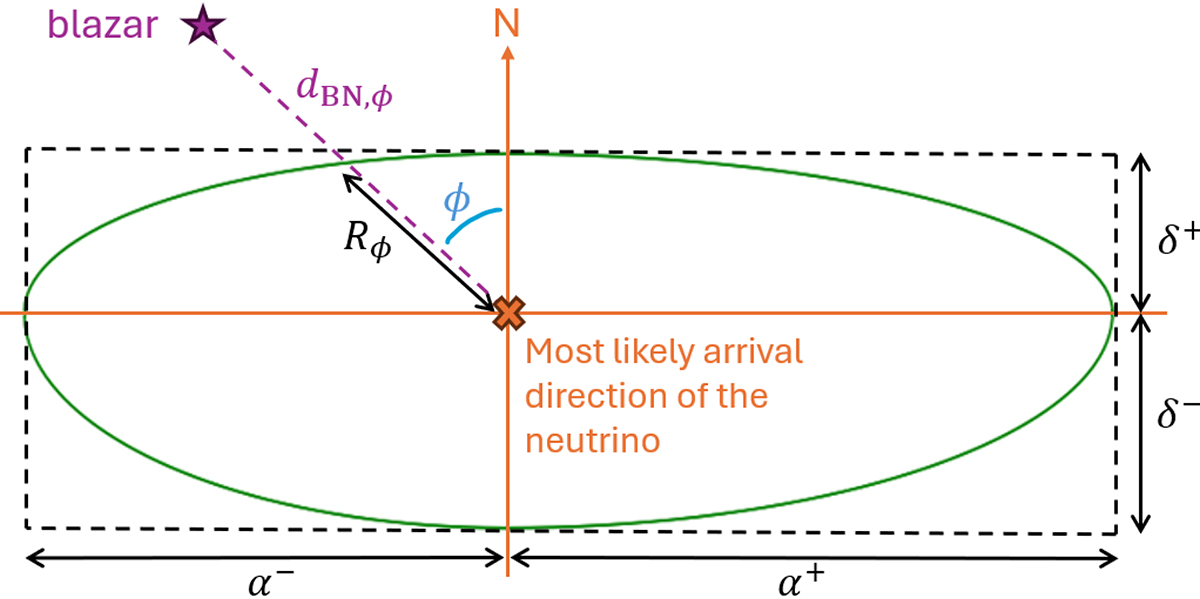
Spatial orientation of an example blazar–neutrino pair. The blazar is shown as a purple star. The most likely arrival direction of the neutrino is shown by the orange cross. The ≳90%-likelihood error region of the neutrino (see Sect. 2.1) is shown by the green ellipsoid. dBN, ϕ is the distance between the blazar and the center of the neutrino error ellipsoid, shown by the dotted purple line. Rϕ is the distance between the edge and center of the ellipsoid along the line that goes through the blazar, shown by the black double-headed arrow oriented at a ϕ angle from the northern axis. α+/− and δ+/− represent the asymmetric 2σ Gaussian error bars in RA and Dec, respectively.
Current usage metrics show cumulative count of Article Views (full-text article views including HTML views, PDF and ePub downloads, according to the available data) and Abstracts Views on Vision4Press platform.
Data correspond to usage on the plateform after 2015. The current usage metrics is available 48-96 hours after online publication and is updated daily on week days.
Initial download of the metrics may take a while.