Open Access
Fig. 7
Download original image
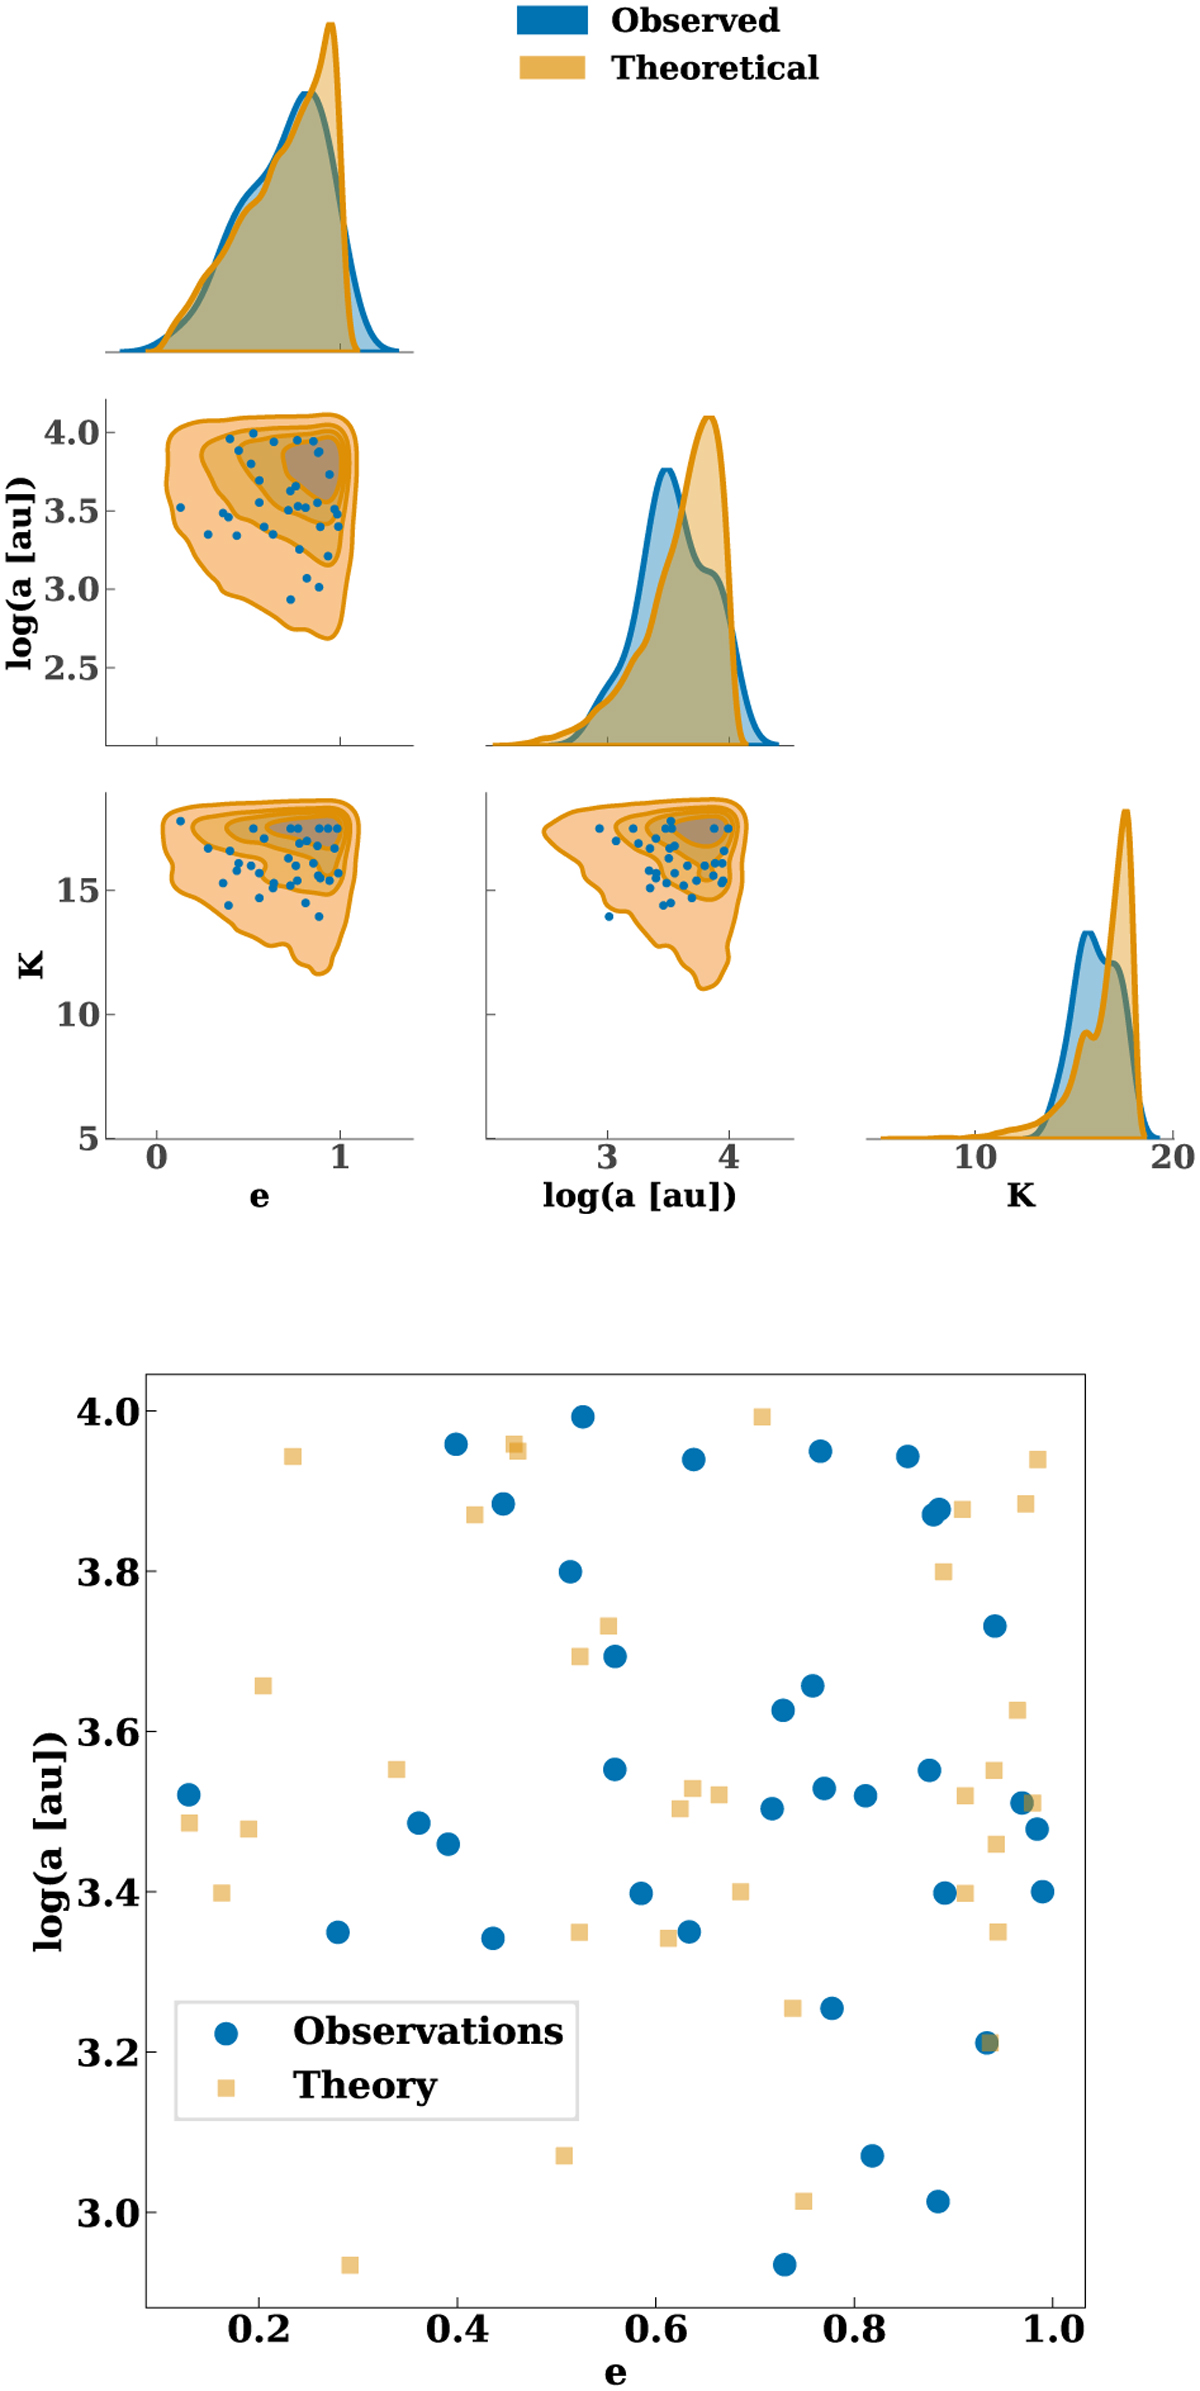
Top panel: corner plot showing distributions of semimajor axis (a), eccentricity (e), and K magnitude from theory (orange) and observations (blue). Bottom panel: eccentricity versus semimajor axis for the observed S stars, and for the model stars that are closest in the semimajor axis.
Current usage metrics show cumulative count of Article Views (full-text article views including HTML views, PDF and ePub downloads, according to the available data) and Abstracts Views on Vision4Press platform.
Data correspond to usage on the plateform after 2015. The current usage metrics is available 48-96 hours after online publication and is updated daily on week days.
Initial download of the metrics may take a while.