Fig. 3
Download original image
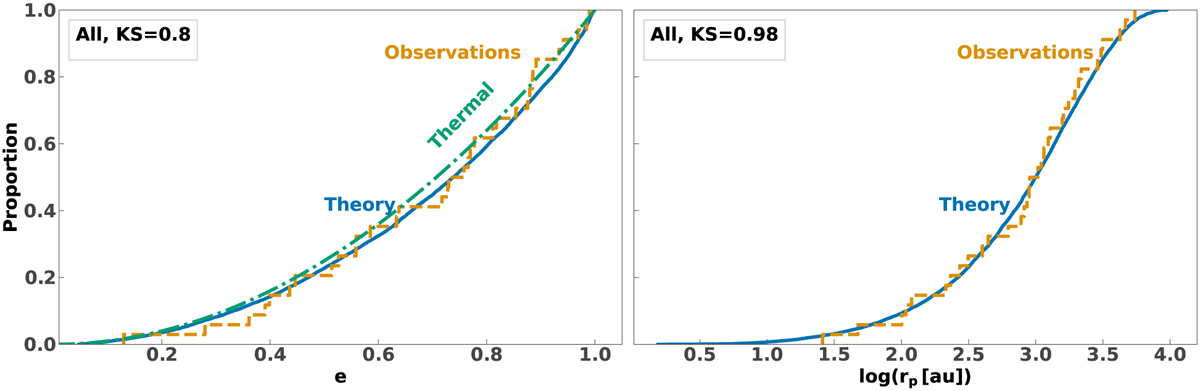
Left panel: cumulative eccentricity distribution from the model (solid blue line), compared to the observed S-star eccentricity distribution (dashed orange line). For reference, we also show a thermal eccentricity distribution (dash-dotted green line). Right panel: cumulative pericenter distribution from our model and observations. The numbers in the legend are the p values from a two-sample KS test with the model and observed distributions.
Current usage metrics show cumulative count of Article Views (full-text article views including HTML views, PDF and ePub downloads, according to the available data) and Abstracts Views on Vision4Press platform.
Data correspond to usage on the plateform after 2015. The current usage metrics is available 48-96 hours after online publication and is updated daily on week days.
Initial download of the metrics may take a while.