Fig. 1
Download original image
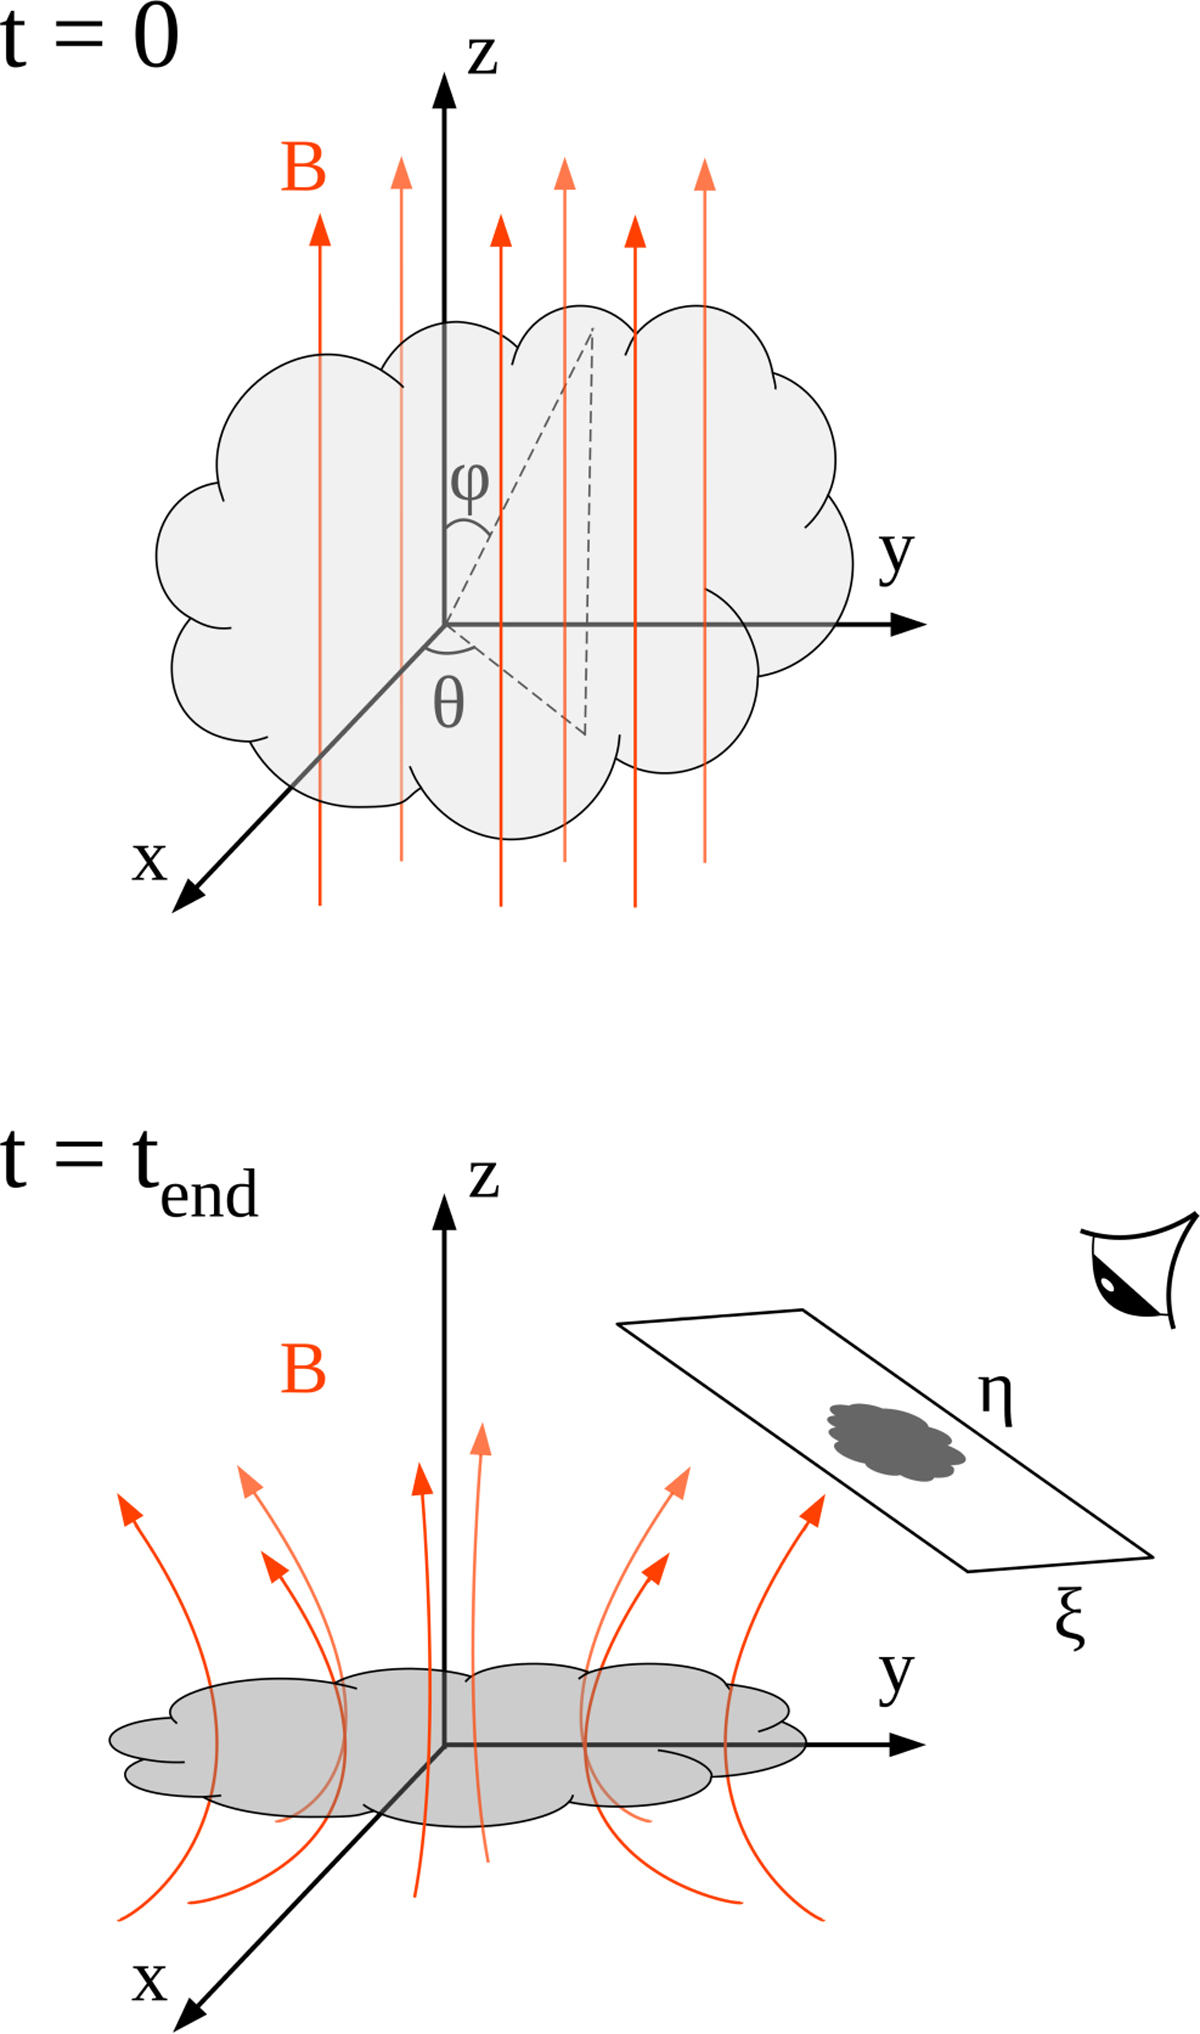
Schematic representations of the initial (upper panel) and final (lower panel) configurations of the cloud along with our definitions for the angles θ and ϕ, and the directions ξ and η on the POS. Orange lines are a schematic representation of the large-scale (i.e., excluding turbulent features) magnetic field. At the time of post-processing the simulation, the cloud has collapsed along the magnetic field, as shown in the bottom panel.
Current usage metrics show cumulative count of Article Views (full-text article views including HTML views, PDF and ePub downloads, according to the available data) and Abstracts Views on Vision4Press platform.
Data correspond to usage on the plateform after 2015. The current usage metrics is available 48-96 hours after online publication and is updated daily on week days.
Initial download of the metrics may take a while.