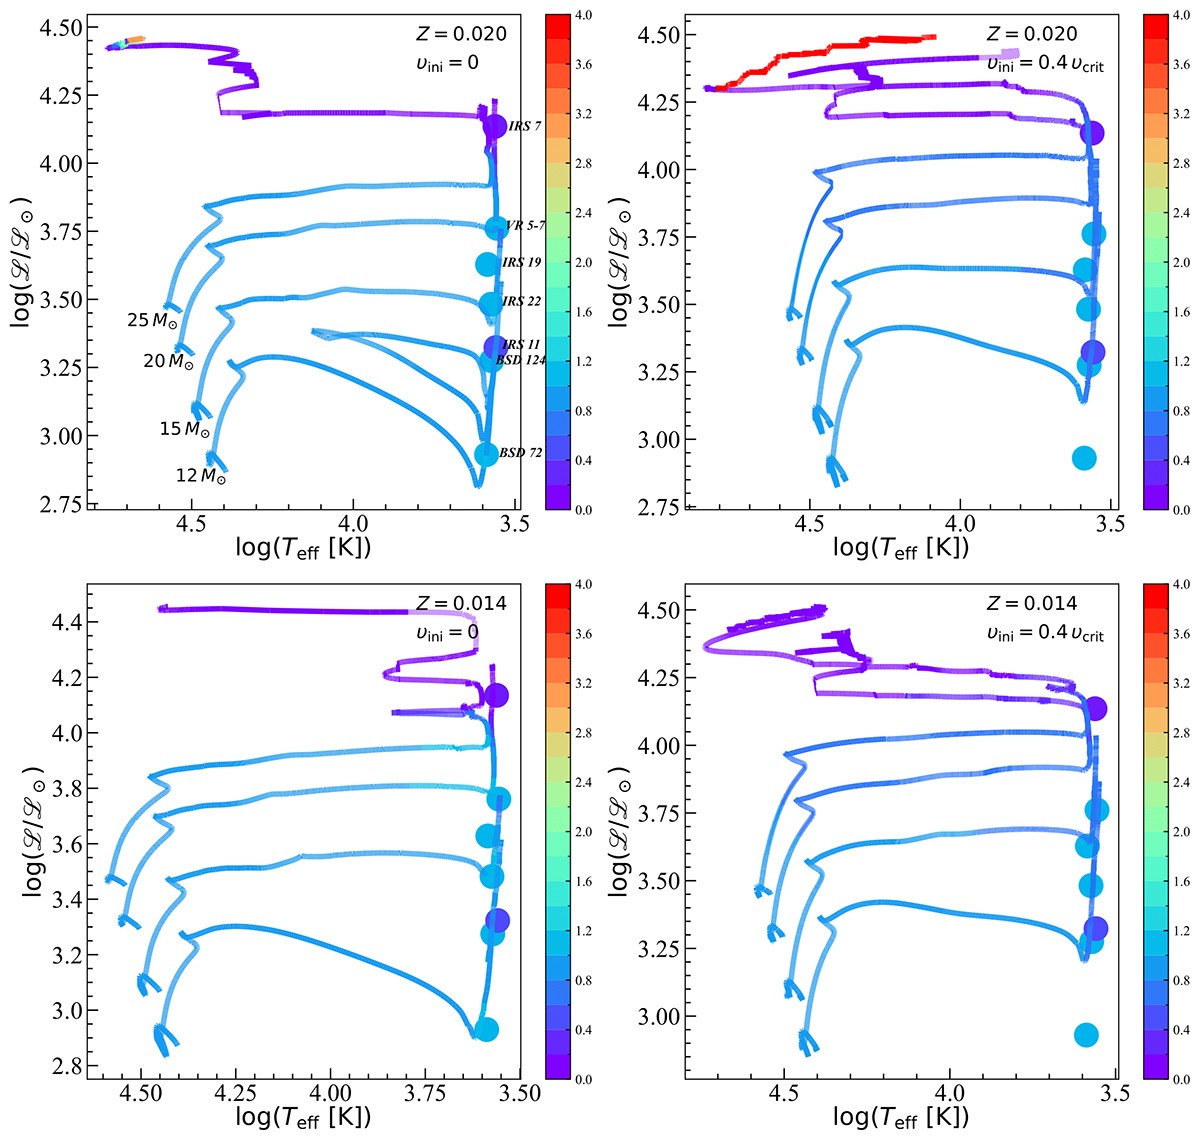
Fig. 1.
Download original image
Evolutionary tracks in the spectroscopic HR diagram (where the logarithm of the luminosity is replaced by the logarithm of ![]() , with g being the surface gravity). The colour scale indicates the surface value of N(19Fs)/N(1Hs), normalised to the ratio’s initial value at ZAMS, where N represents the number density of the considered isotope. The rotation and the metallicity are indicated in each panel. The points represent the fluorine abundance determined from observations by Guerço et al. (2022b) and Guerço et al. (2022a).
, with g being the surface gravity). The colour scale indicates the surface value of N(19Fs)/N(1Hs), normalised to the ratio’s initial value at ZAMS, where N represents the number density of the considered isotope. The rotation and the metallicity are indicated in each panel. The points represent the fluorine abundance determined from observations by Guerço et al. (2022b) and Guerço et al. (2022a).
Current usage metrics show cumulative count of Article Views (full-text article views including HTML views, PDF and ePub downloads, according to the available data) and Abstracts Views on Vision4Press platform.
Data correspond to usage on the plateform after 2015. The current usage metrics is available 48-96 hours after online publication and is updated daily on week days.
Initial download of the metrics may take a while.