Fig. 7
Download original image
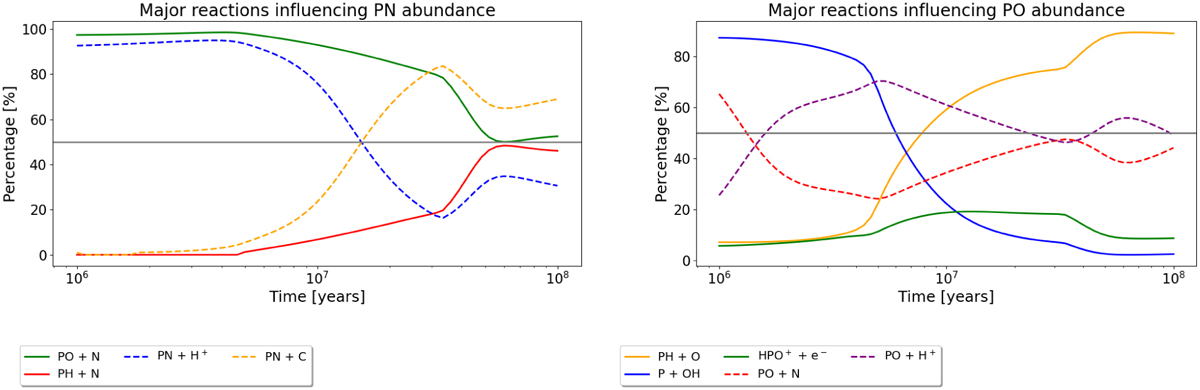
Major reactions for a) PN and b) PO. The contributions of each reaction are represented as percentages over time. Solid and dashed lines differentiate production and destruction mechanisms, respectively. The time is presented on a logarithmic scale to highlight contributions beyond 106 years, with a horizontal grey line at 50% for assessing balance throughout the duration of the long-term trends in the chemical network.
Current usage metrics show cumulative count of Article Views (full-text article views including HTML views, PDF and ePub downloads, according to the available data) and Abstracts Views on Vision4Press platform.
Data correspond to usage on the plateform after 2015. The current usage metrics is available 48-96 hours after online publication and is updated daily on week days.
Initial download of the metrics may take a while.