Fig. 4.
Download original image
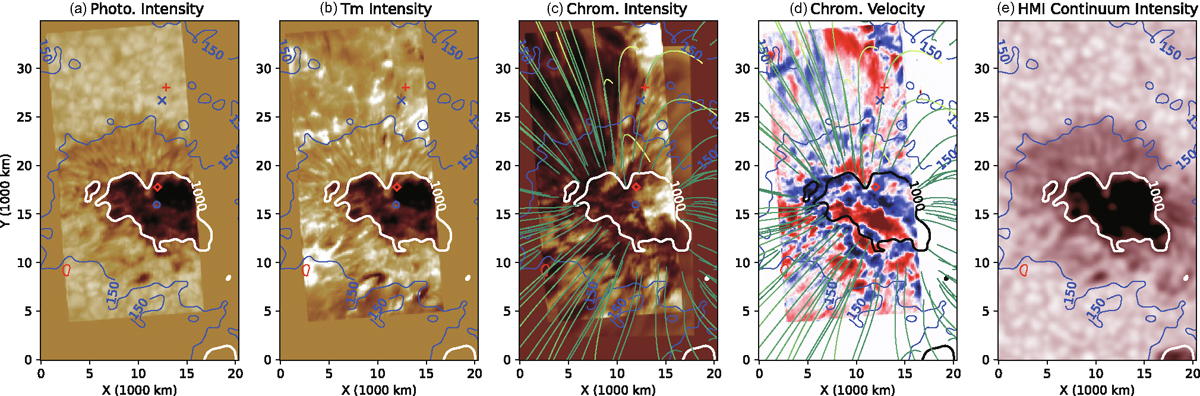
Maps of (a) photospheric intensity, (b) temperature minimum intensity, (c) chromospheric intensity, and (d) band-filtered (1.5–4.0 minutes) chromospheric velocity taken by FISS Hα spectra at 20:39 UT of June 22, 2018. For the alignment, (e) the SDO/HMI continuum intensity map is also shown. The white and blue contours indicate a positive LOS magnetogram of 1000 Gauss and 150 Gauss, repectively. The red contour marks the negative LOS magnetogram of 150 Gauss. The green lines represent the magnetic field lines constructed using the linear-force-free extrapolation method, with footpoints located at regions where the LOS magnetic field ranges from 150 to 1000 Gauss. The lighter green color signals that the height of magnetic field is higher. The symbols mark the sample positions for measuring the transverse oscillations in Figs. 5 and 6.
Current usage metrics show cumulative count of Article Views (full-text article views including HTML views, PDF and ePub downloads, according to the available data) and Abstracts Views on Vision4Press platform.
Data correspond to usage on the plateform after 2015. The current usage metrics is available 48-96 hours after online publication and is updated daily on week days.
Initial download of the metrics may take a while.