Fig. 3.
Download original image
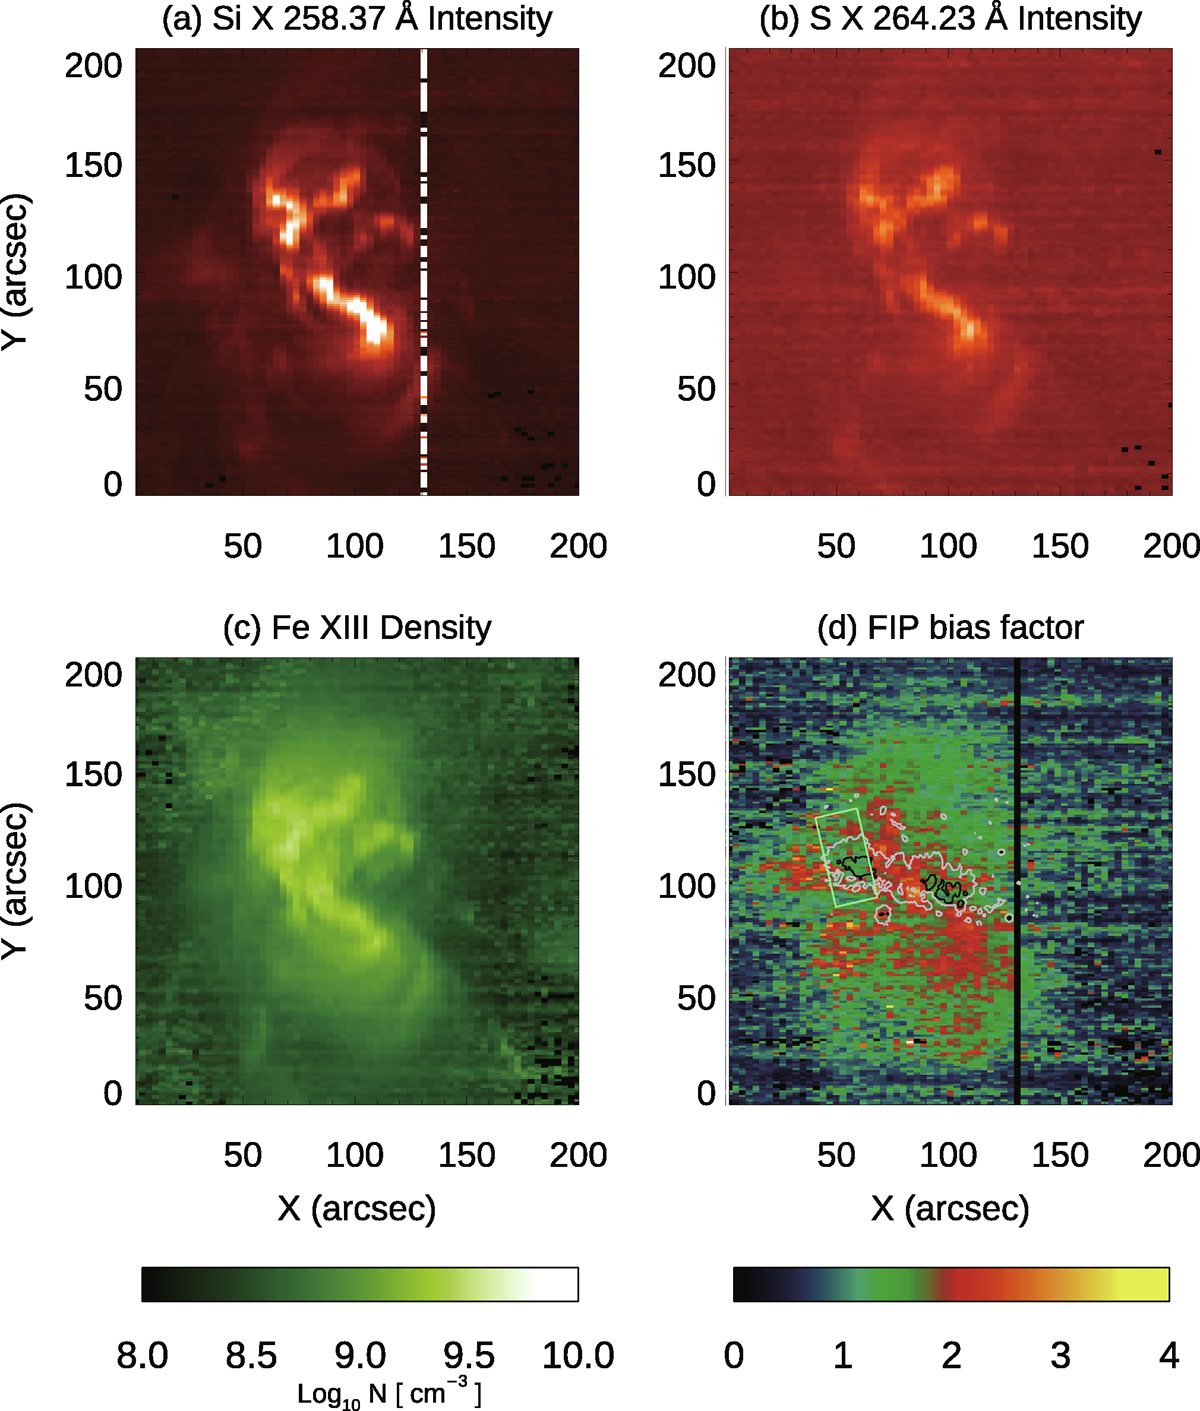
Intensity maps from (a) Si X 258.37 Å and (b) S X 264.23 Å. (c) Density map from the ratio of Fe XIII 202.04 Å and 203.83 Å. (d) FIP bias factor map from the ratio of S X 264.23 Å and Si X 258.37 Å. The black and gray contours in panel (d) outline the umbra and penumbra boundaries, respectively. The green box corresponds to the FOV of FISS.
Current usage metrics show cumulative count of Article Views (full-text article views including HTML views, PDF and ePub downloads, according to the available data) and Abstracts Views on Vision4Press platform.
Data correspond to usage on the plateform after 2015. The current usage metrics is available 48-96 hours after online publication and is updated daily on week days.
Initial download of the metrics may take a while.