Open Access
Fig. 7
Download original image
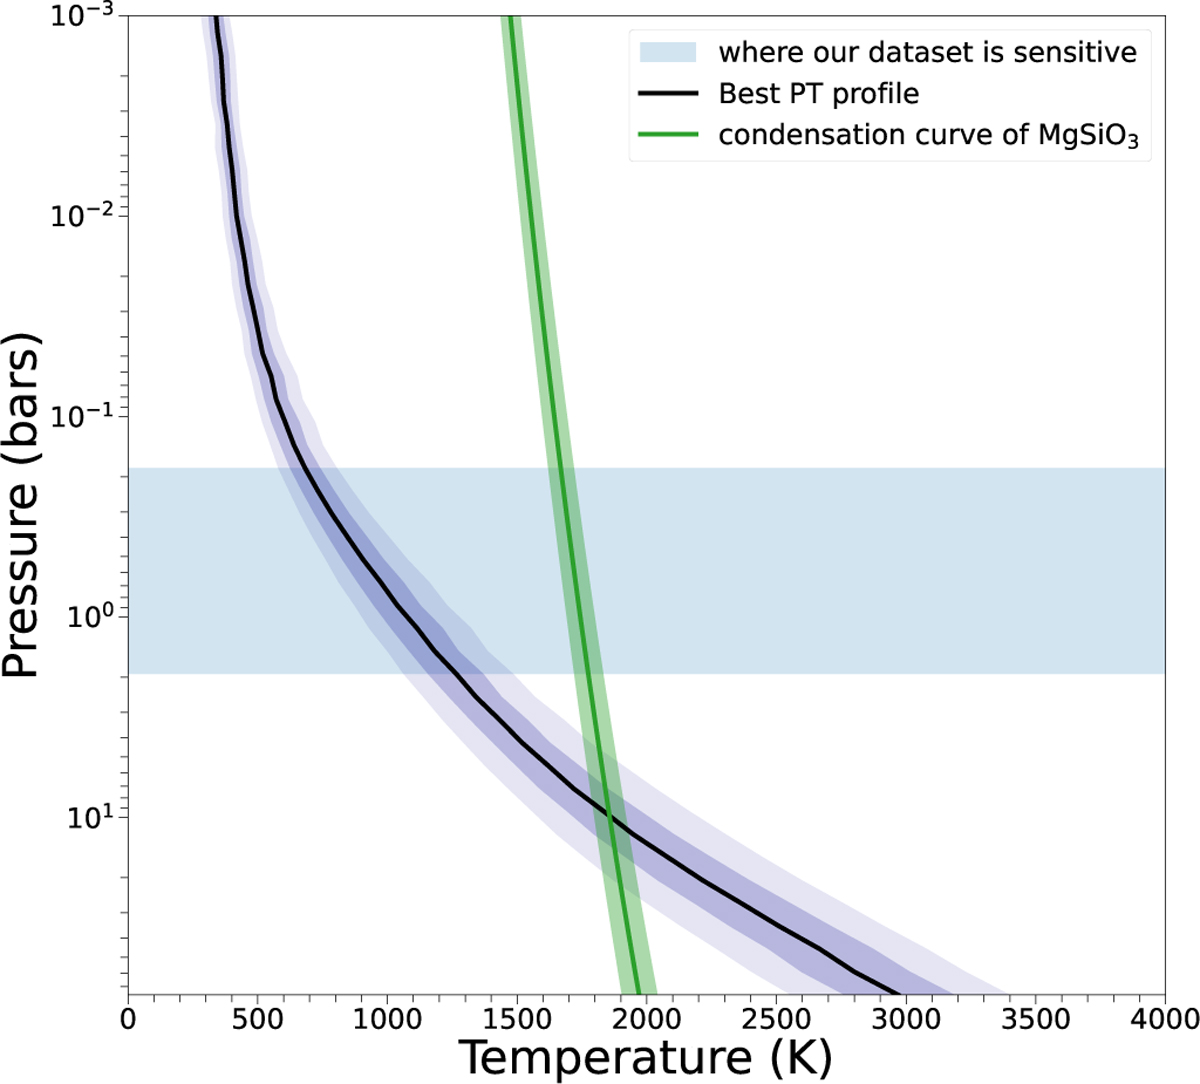
P-T profile with 1σ and 2σ uncertainties derived from the results of combining the 2 nights. In green we show the 1σ condensation curve of MgSiO3 . The shaded blue region corresponds to the pressure levels to which our data are most sensitive.
Current usage metrics show cumulative count of Article Views (full-text article views including HTML views, PDF and ePub downloads, according to the available data) and Abstracts Views on Vision4Press platform.
Data correspond to usage on the plateform after 2015. The current usage metrics is available 48-96 hours after online publication and is updated daily on week days.
Initial download of the metrics may take a while.