Open Access
Fig. 5
Download original image
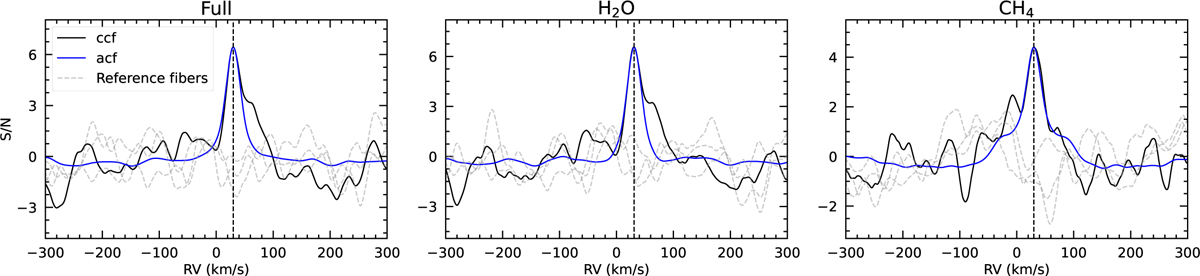
Cross-correlation functions for the first night with the Exo-REM/Exo_k model. In grey, the cross-correlation between the signal of the 3 reference fibers and the best model. In blue, the auto-correlation between the best model and itself. The model has been broadened at the v sin i given by the fit.
Current usage metrics show cumulative count of Article Views (full-text article views including HTML views, PDF and ePub downloads, according to the available data) and Abstracts Views on Vision4Press platform.
Data correspond to usage on the plateform after 2015. The current usage metrics is available 48-96 hours after online publication and is updated daily on week days.
Initial download of the metrics may take a while.