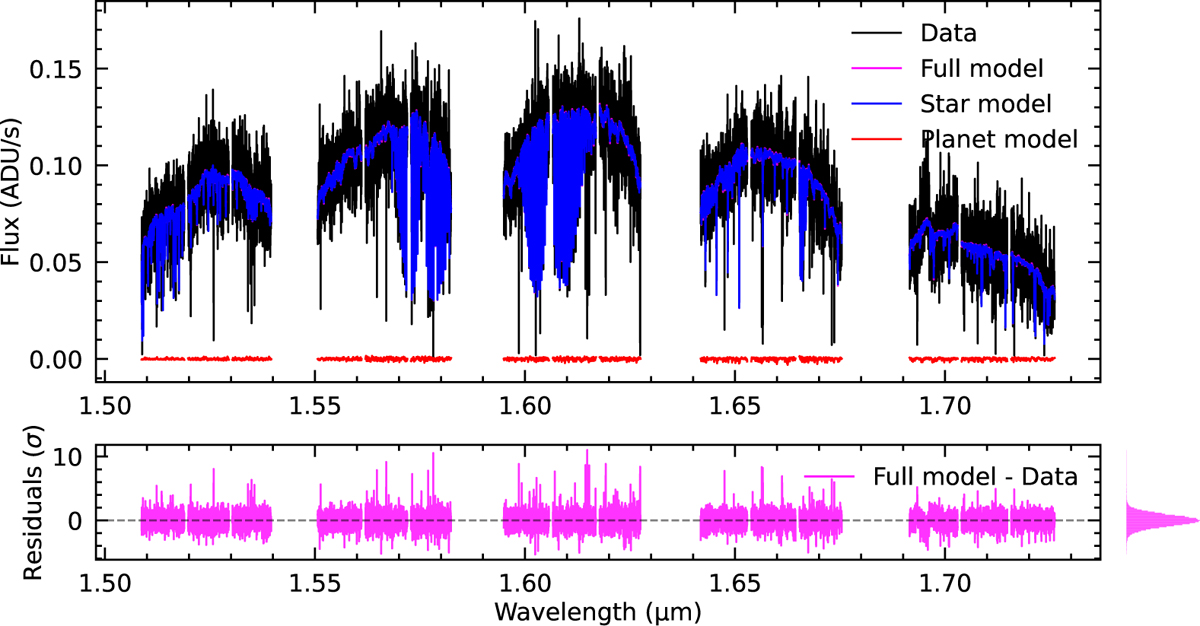
Fig. 3
Download original image
Best-fit model for the 2023-11-23 data with the Exo-REM/Exo_k model. Top panel shows the data, the full model (magenta), the stellar model (blue) and the planet model (red). The last two are scaled to their respective amplitude in the total signal. The stellar component in the data completely dominates the planetary component, so the full model (magenta) is mostly hidden by the star model (blue). Bottom panel shows the residuals, i.e., the data subtracted by the full model. For this panel, the scale is the standard deviation of the residuals. The top of the lower part of the figure depicts the distribution of the residuals, which is well centered around 0.
Current usage metrics show cumulative count of Article Views (full-text article views including HTML views, PDF and ePub downloads, according to the available data) and Abstracts Views on Vision4Press platform.
Data correspond to usage on the plateform after 2015. The current usage metrics is available 48-96 hours after online publication and is updated daily on week days.
Initial download of the metrics may take a while.