Fig. A.1
Download original image
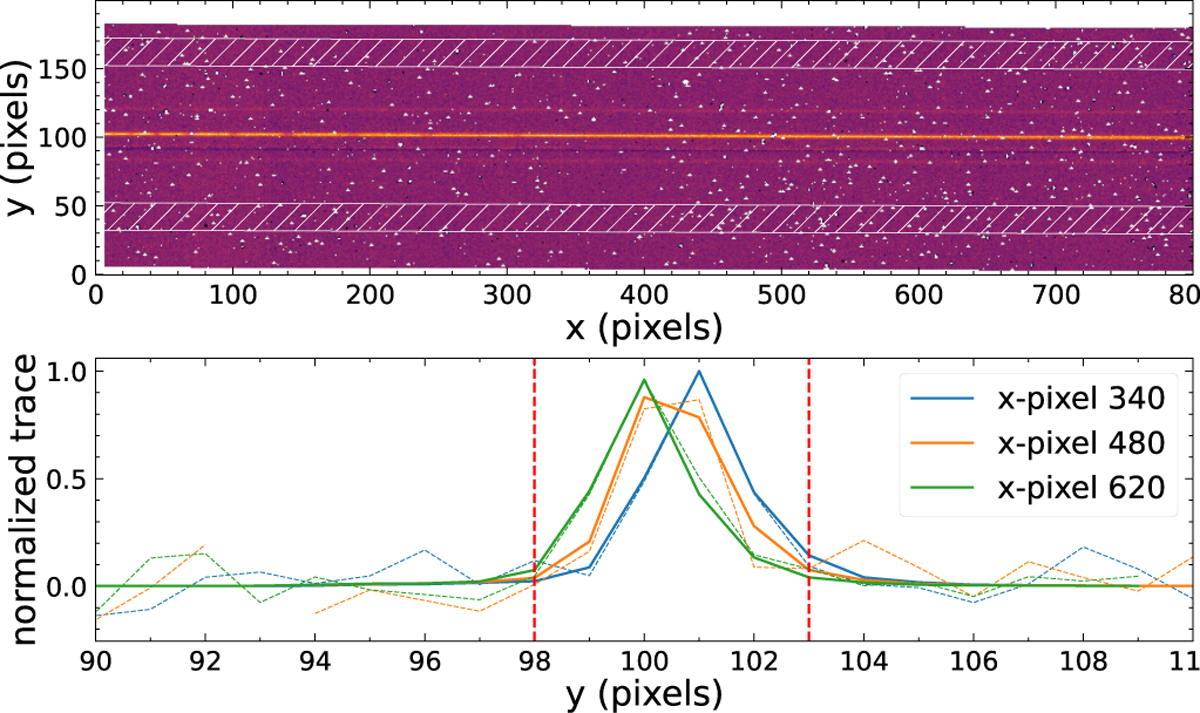
Trace of the CRIRES+ detector for a single order. Top panel: 2D detector image of the companion. The hatched area corresponds to the noise estimation region. The spectrum of the companion is located at the center of the image, around the y-pixel number 100. Around y-pixel 90 is the residual MACAO internal source fiber signal after background subtraction. Around y-pixel number 115 and y-pixel number 85, we can see the signal of 2 of the 3 reference fibers. The bad pixels are depicted in white. Bottom panel: normalized profile between y-pixels 90 and 110 of the signal at x-pixels 340, 480 and 620 for the star (solid lines) and the companion (dashed lines). The extracted signal area is represented by the vertical red dashed lines.
Current usage metrics show cumulative count of Article Views (full-text article views including HTML views, PDF and ePub downloads, according to the available data) and Abstracts Views on Vision4Press platform.
Data correspond to usage on the plateform after 2015. The current usage metrics is available 48-96 hours after online publication and is updated daily on week days.
Initial download of the metrics may take a while.