Open Access
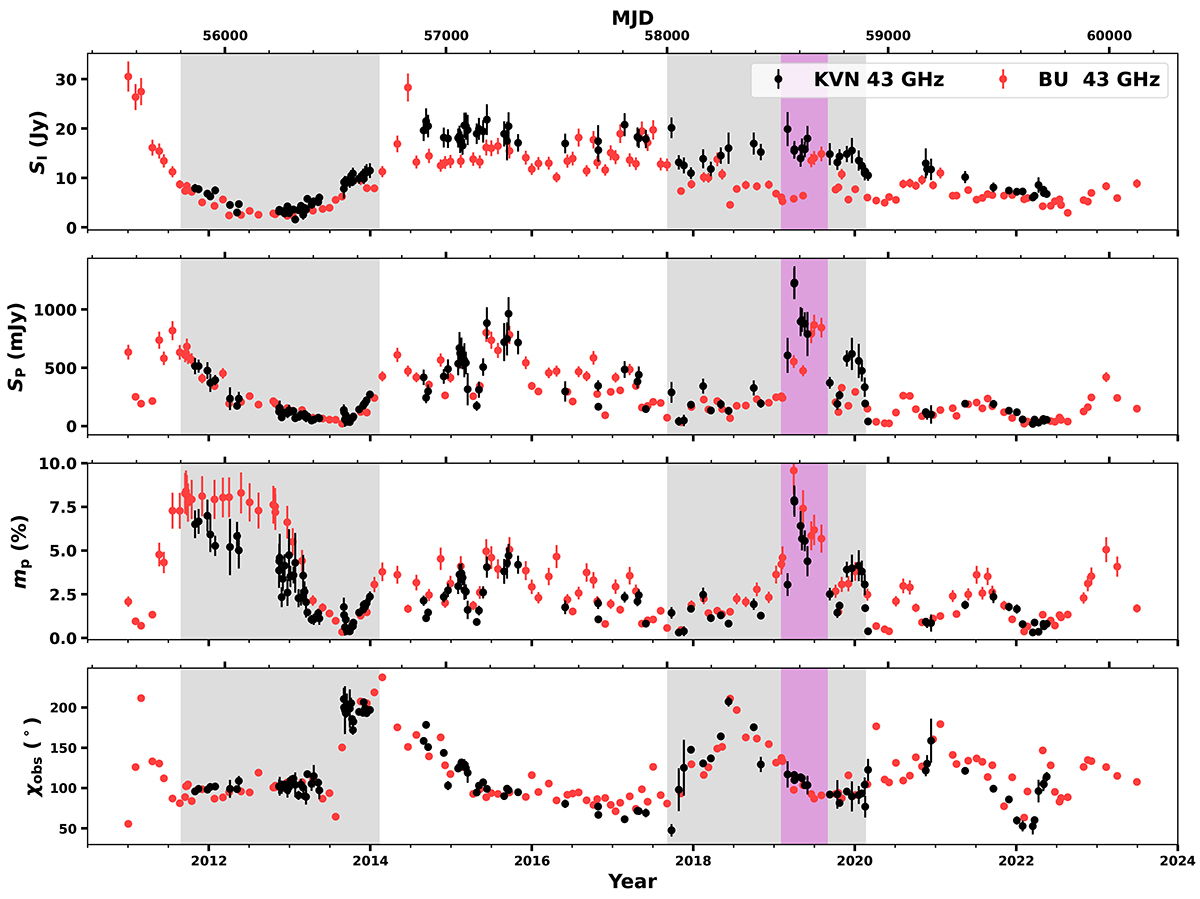
Fig. A.1.
Download original image
Comparison of the light curves at 43 GHz obtained from the KVN single-dish (black) and the VLBA (red). The flux density from the VLBA observations was estimated using the CLEAN models.
Current usage metrics show cumulative count of Article Views (full-text article views including HTML views, PDF and ePub downloads, according to the available data) and Abstracts Views on Vision4Press platform.
Data correspond to usage on the plateform after 2015. The current usage metrics is available 48-96 hours after online publication and is updated daily on week days.
Initial download of the metrics may take a while.