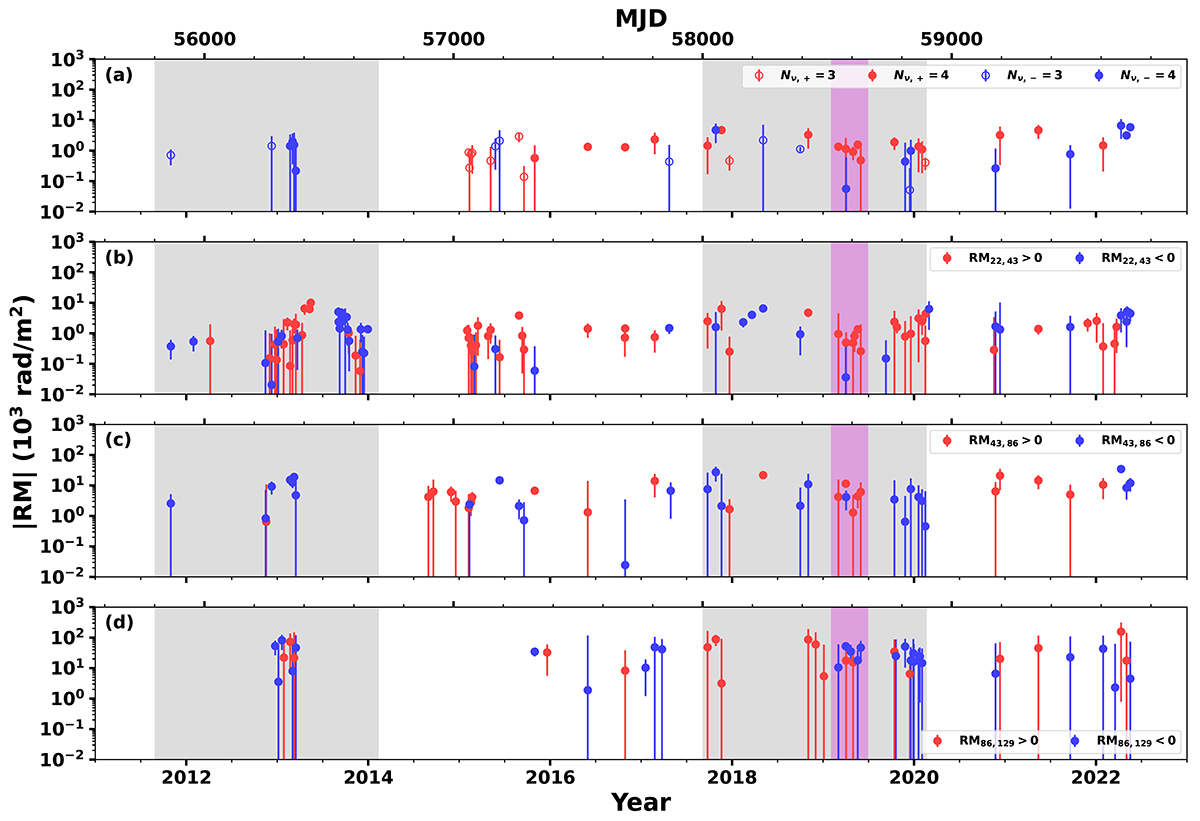
Fig. 5.
Download original image
RMs in the first panel (top) were obtained via linear fit (χ = χ0 + RM λ2) if more than two data points were available. There are several large uncertainties (σRM ≳ |RM|) attributed mainly to a significant deviation in χobs to a linear relation. From the second to the last panels, RMs were calculated in pairs of 22–43 GHz (second), 43–86 GHz (third), and 86–129 GHz (bottom). RM signs are shown in color: blue and red for negative and positive signs, respectively. The filled and open circles in the first panel indicate the number of frequencies used in the fitting, four and three data points, respectively. Each shaded area is the same as in Figure 1.
Current usage metrics show cumulative count of Article Views (full-text article views including HTML views, PDF and ePub downloads, according to the available data) and Abstracts Views on Vision4Press platform.
Data correspond to usage on the plateform after 2015. The current usage metrics is available 48-96 hours after online publication and is updated daily on week days.
Initial download of the metrics may take a while.