Open Access
Fig. 4.
Download original image
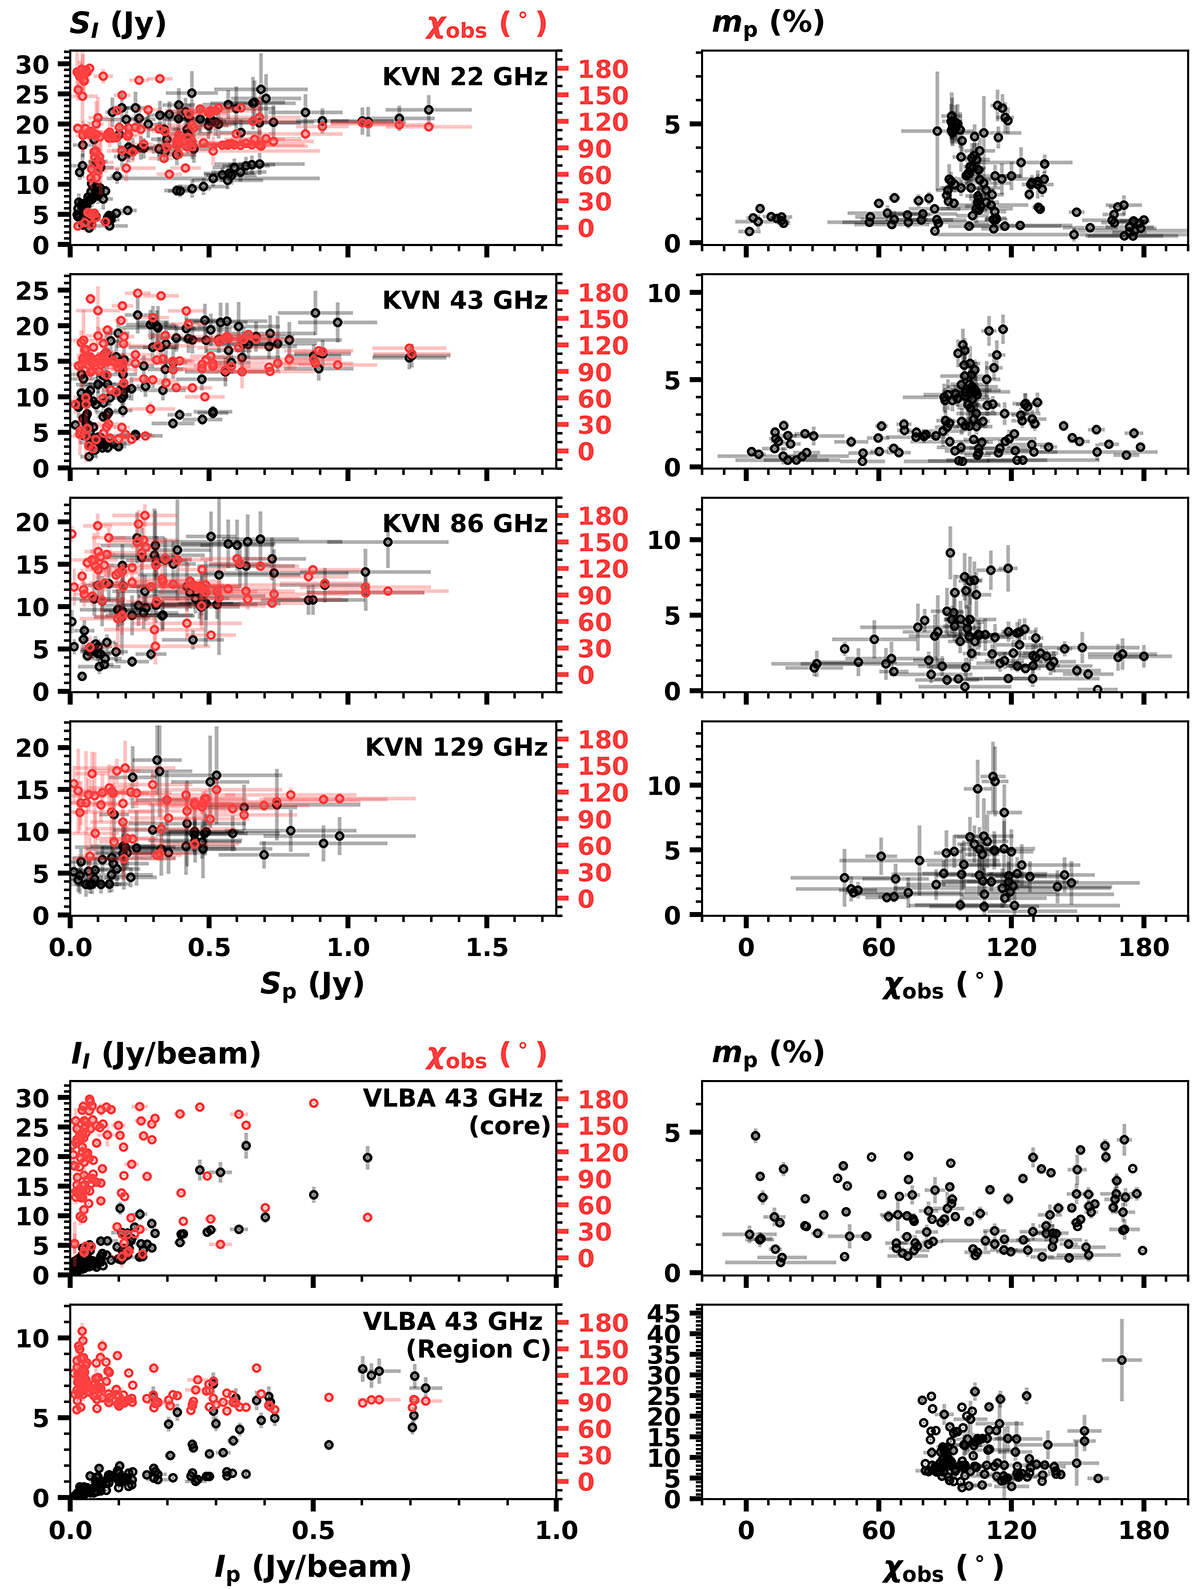
Left: dependence of total emission (black symbols) and χobs (red symbols) on polarized emission for the KVN data at different frequencies (first four panels) and the two different jet regions from the VLBA 43 GHz, the core and Region C (last two panels). Right: dependence of mp on χobs.
Current usage metrics show cumulative count of Article Views (full-text article views including HTML views, PDF and ePub downloads, according to the available data) and Abstracts Views on Vision4Press platform.
Data correspond to usage on the plateform after 2015. The current usage metrics is available 48-96 hours after online publication and is updated daily on week days.
Initial download of the metrics may take a while.