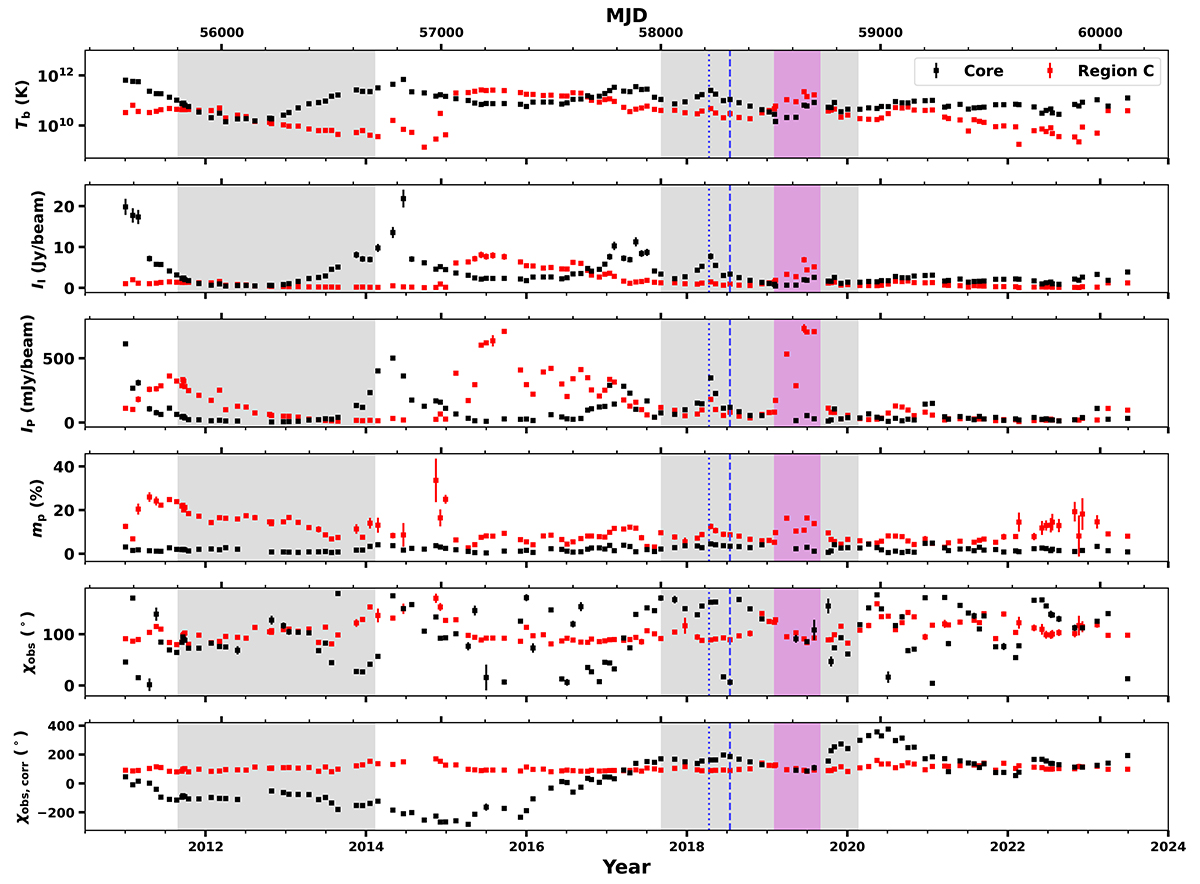
Fig. 3.
Download original image
Estimated values of the regions related to the core and Region C at 43 GHz. Each value was obtained by computing the corresponding pixels. The first four panels (from top to bottom) indicate brightness temperature, total intensity, linearly polarized intensity, and polarization degree. The last two panels are polarization angles, but the one in the bottom panel was obtained after resolving the nπ-ambiguity following the method in Blinov et al. (2016). The blue dotted and dashed lines show the ejection and segmentation time of knot B19 (Weaver et al. 2022).
Current usage metrics show cumulative count of Article Views (full-text article views including HTML views, PDF and ePub downloads, according to the available data) and Abstracts Views on Vision4Press platform.
Data correspond to usage on the plateform after 2015. The current usage metrics is available 48-96 hours after online publication and is updated daily on week days.
Initial download of the metrics may take a while.