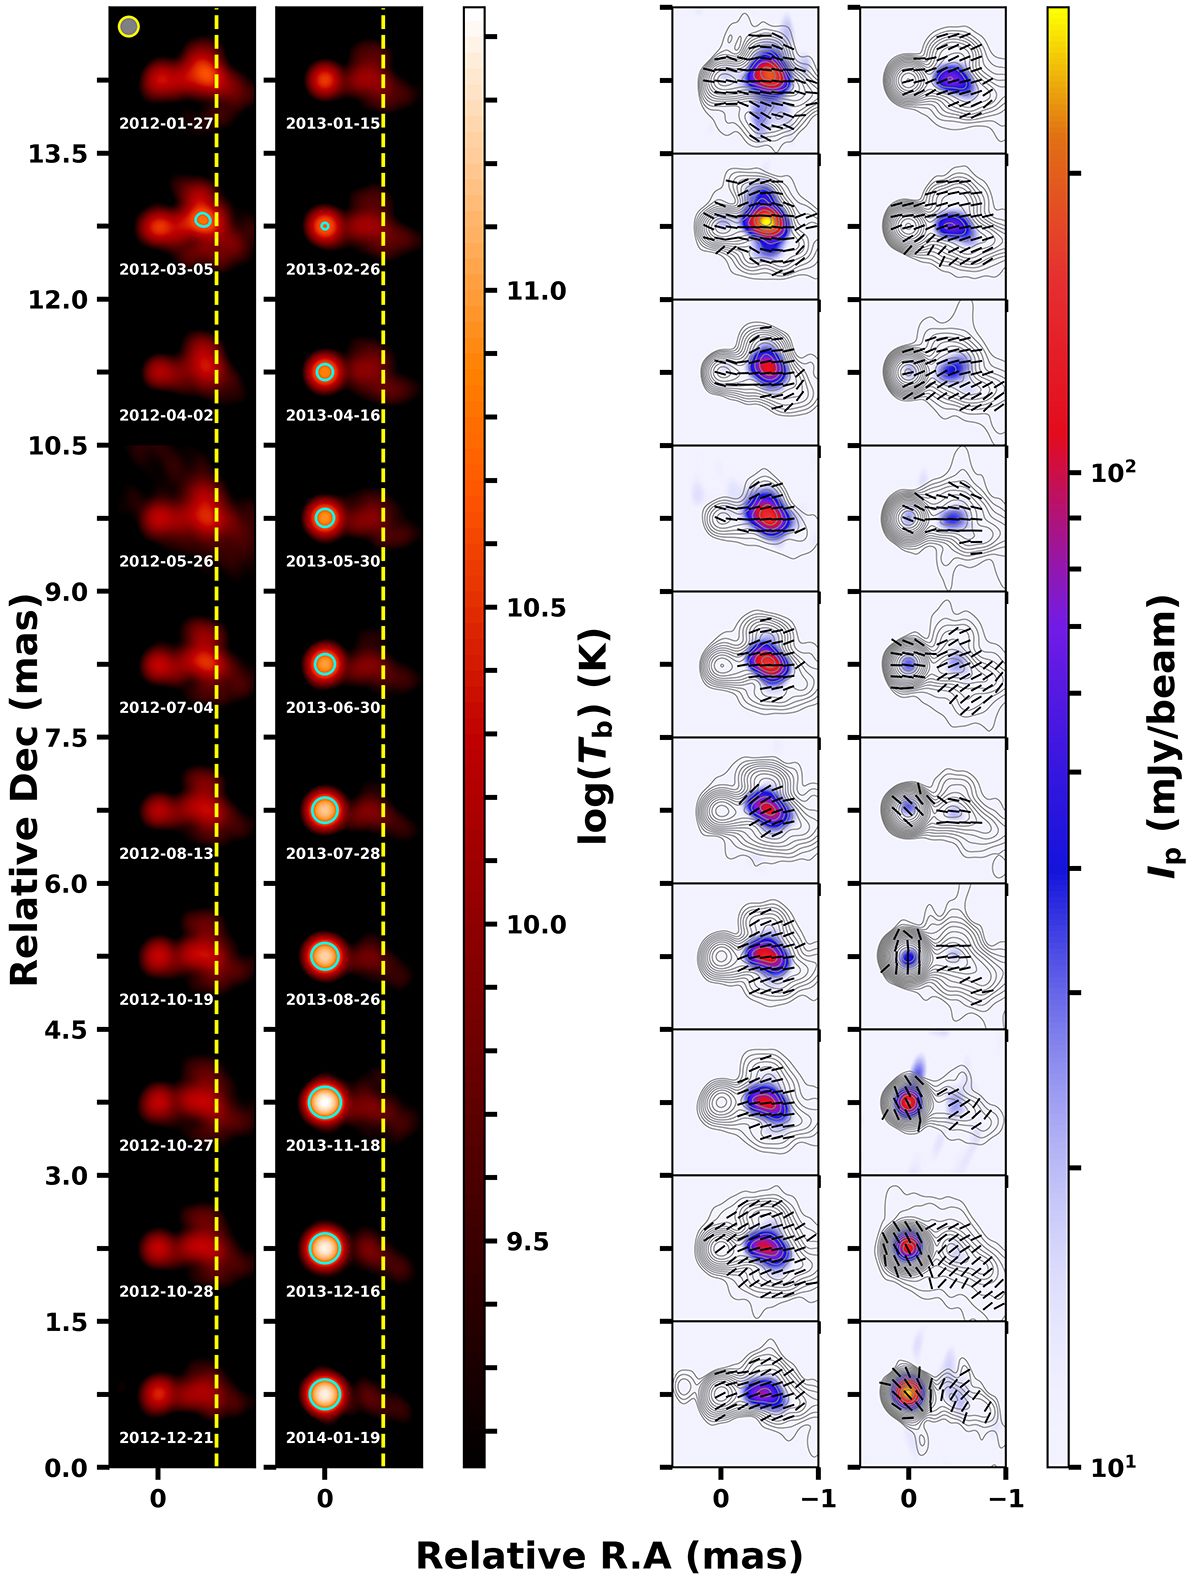
Fig. 2.
Download original image
Left: 43 GHz VLBA images in terms of the brightness temperature Tb in the source rest frame. The right ascension of the radio core is fixed to 0. The cyan contours indicate where Tb = Teq ≈ 5 × 10¹⁰ K. The yellow dashed lines present the location 0.6 mas from the core, a typical projected distance of Region C (0.45–0.7 mas; Weaver et al. 2022). Right: contours obtained from Stokes I images, starting from 3σrms level, where σrms represents the r.m.s noise level in a residual map. The color maps show linear polarization intensity. All the images are convolved with a beam size of 0.2 × 0.2 mas2. The black bars indicate the observed polarization angle on the images where the S/N of the polarized emission is higher than 3.
Current usage metrics show cumulative count of Article Views (full-text article views including HTML views, PDF and ePub downloads, according to the available data) and Abstracts Views on Vision4Press platform.
Data correspond to usage on the plateform after 2015. The current usage metrics is available 48-96 hours after online publication and is updated daily on week days.
Initial download of the metrics may take a while.