Fig. 1.
Download original image
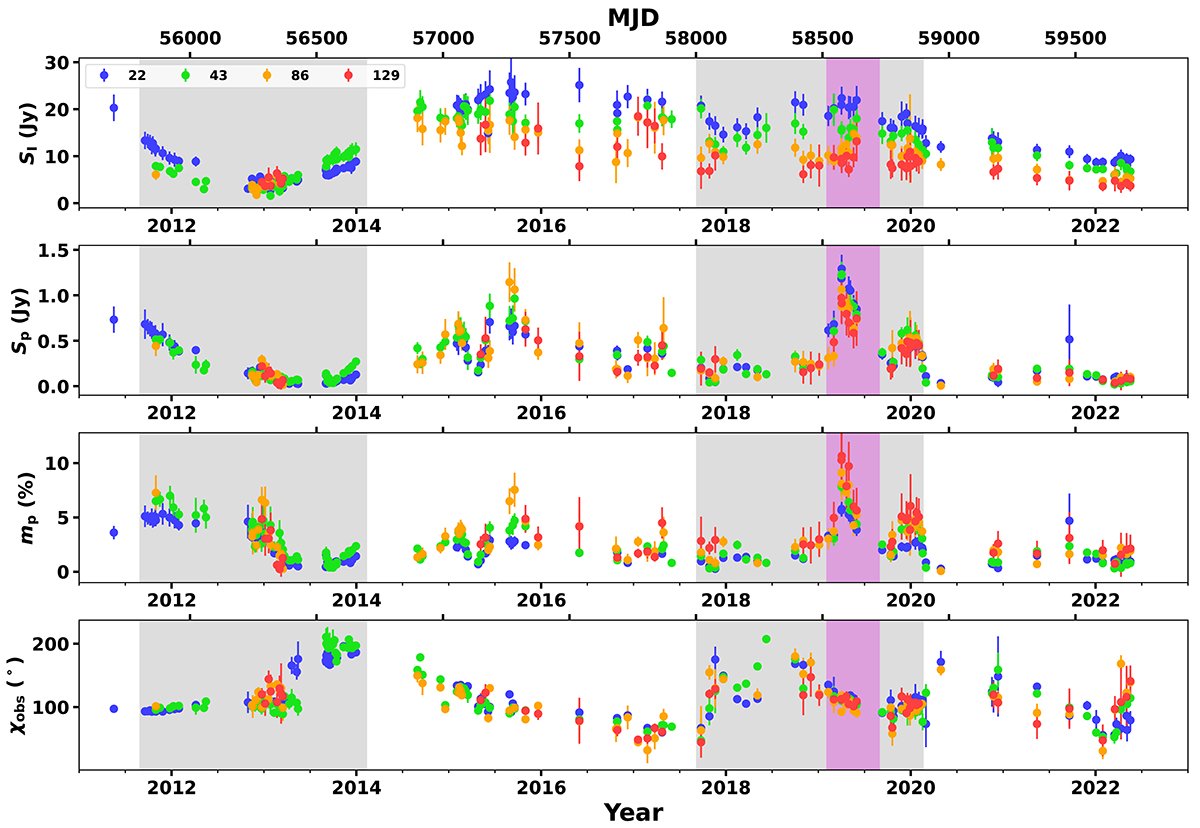
Results of the KVN observations at 22 (blue), 43 (green), 86 (orange), and 129 GHz (red). Each panel shows the total flux density, linearly polarized flux density, polarization degree, and polarization angle (from top to bottom). The two time periods that we focus on in this work are shown in the gray shaded regions and discussed in Section 3.1. The magenta shaded area indicates a flaring period in polarized emission.
Current usage metrics show cumulative count of Article Views (full-text article views including HTML views, PDF and ePub downloads, according to the available data) and Abstracts Views on Vision4Press platform.
Data correspond to usage on the plateform after 2015. The current usage metrics is available 48-96 hours after online publication and is updated daily on week days.
Initial download of the metrics may take a while.