Fig. 9
Download original image
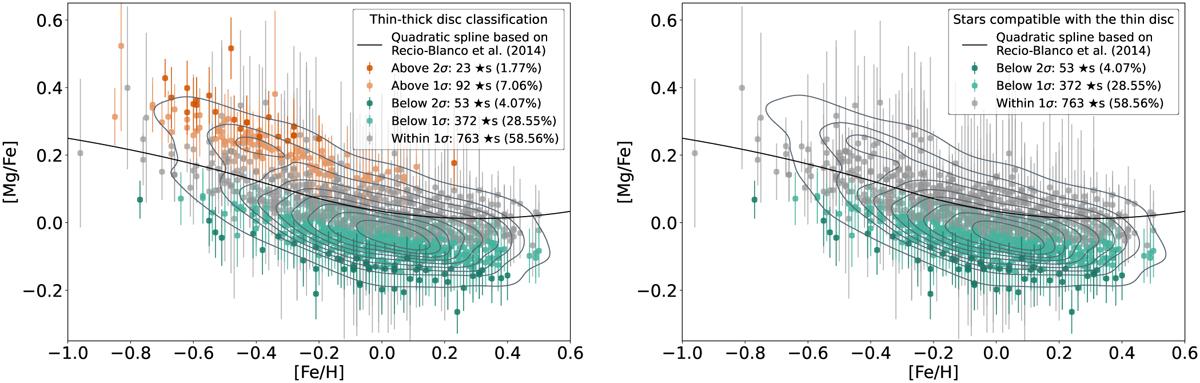
[Mg/Fe] against [Fe/H] for all disc stars in our sample (left panel) and for the stars compatible with the thin disc (right panel). Grey markers indicate stars that are compatible within 1σ of the quadratic spline threshold line based on Recio-Blanco et al. (2014). Stars classified as belonging to the thin disc are shown in shades of cyan, while those associated with the thick disc are depicted in shades of orange. The varying shades represent classifications based on whether the stars fall within 1 or 2σ. It is important to note that stars classified within 1σ in the figure exclude those classified within 2σ to avoid double counting in the legend. In other words, the actual number of stars classified within 1σ is the sum of those shown in both the 1 and 2σ categories, meaning 115 and 425 stars for those above and below threshold respectively. Additionally, dark grey 2D Gaussian kernel densities are overlaid, revealing a double peak in star density: a prominent peak below the thin disc threshold and a secondary peak at low metallicity, highlighting the likely location of most potential interlopers from the thick disc.
Current usage metrics show cumulative count of Article Views (full-text article views including HTML views, PDF and ePub downloads, according to the available data) and Abstracts Views on Vision4Press platform.
Data correspond to usage on the plateform after 2015. The current usage metrics is available 48-96 hours after online publication and is updated daily on week days.
Initial download of the metrics may take a while.