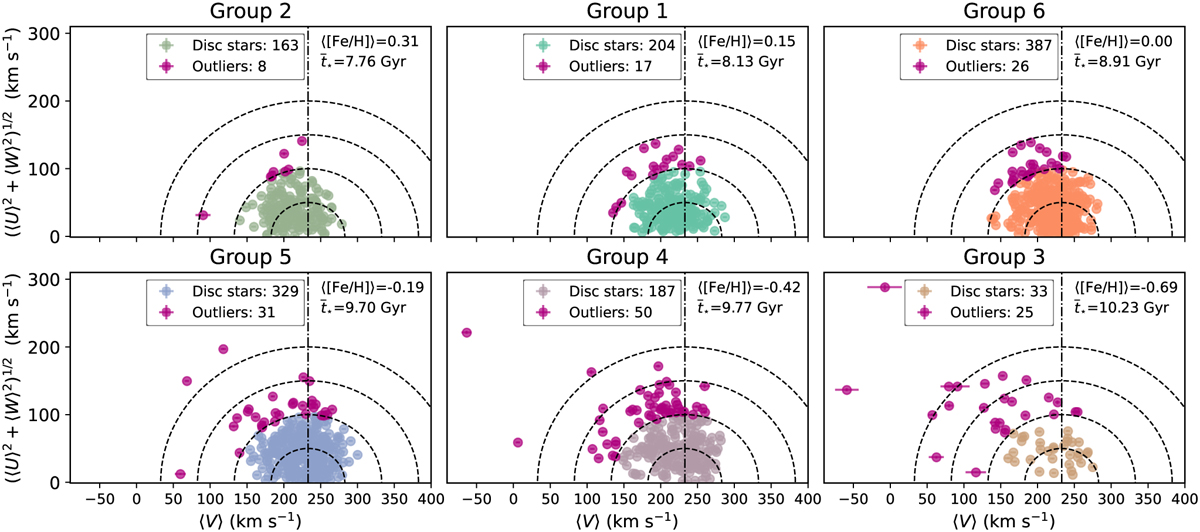
Fig. 7
Download original image
Toomre diagram illustrating the six groups extracted from the HC, arranged in descending order of median metallicity, 〈[Fe/H]〉. The vertical dot-dashed line marks the Sun’s velocity at 232.8 km s−1, as estimated by McMillan (2017). Concentric dashed circles represent constant total velocities of 50, 100, 150, and 200 km s−1, centred around the Sun’s velocity in this diagram. Velocities are corrected for the solar motion using {U⊙, V⊙, W⊙} = {8.6±0.9, 13.9±1.0, 7.1±1.0} km s−1, following the values reported by McMillan (2017, Table 2). A consistent range on both axes is maintained to facilitate comparison across groups and highlight outliers, particularly those with lower metallicities. The colour scheme corresponds to that used in previous figures: stars with combined velocities exceeding 100 km s−1 are designated as outliers and marked in magenta. Subplot labels indicate the number of disc stars and outliers for each group, with 〈[Fe/H]〉 and stellar ages, t★, presented. The number of stars likely to belong to the disc as well as the number of outliers are shown in the top legend box.
Current usage metrics show cumulative count of Article Views (full-text article views including HTML views, PDF and ePub downloads, according to the available data) and Abstracts Views on Vision4Press platform.
Data correspond to usage on the plateform after 2015. The current usage metrics is available 48-96 hours after online publication and is updated daily on week days.
Initial download of the metrics may take a while.