Fig. 6
Download original image
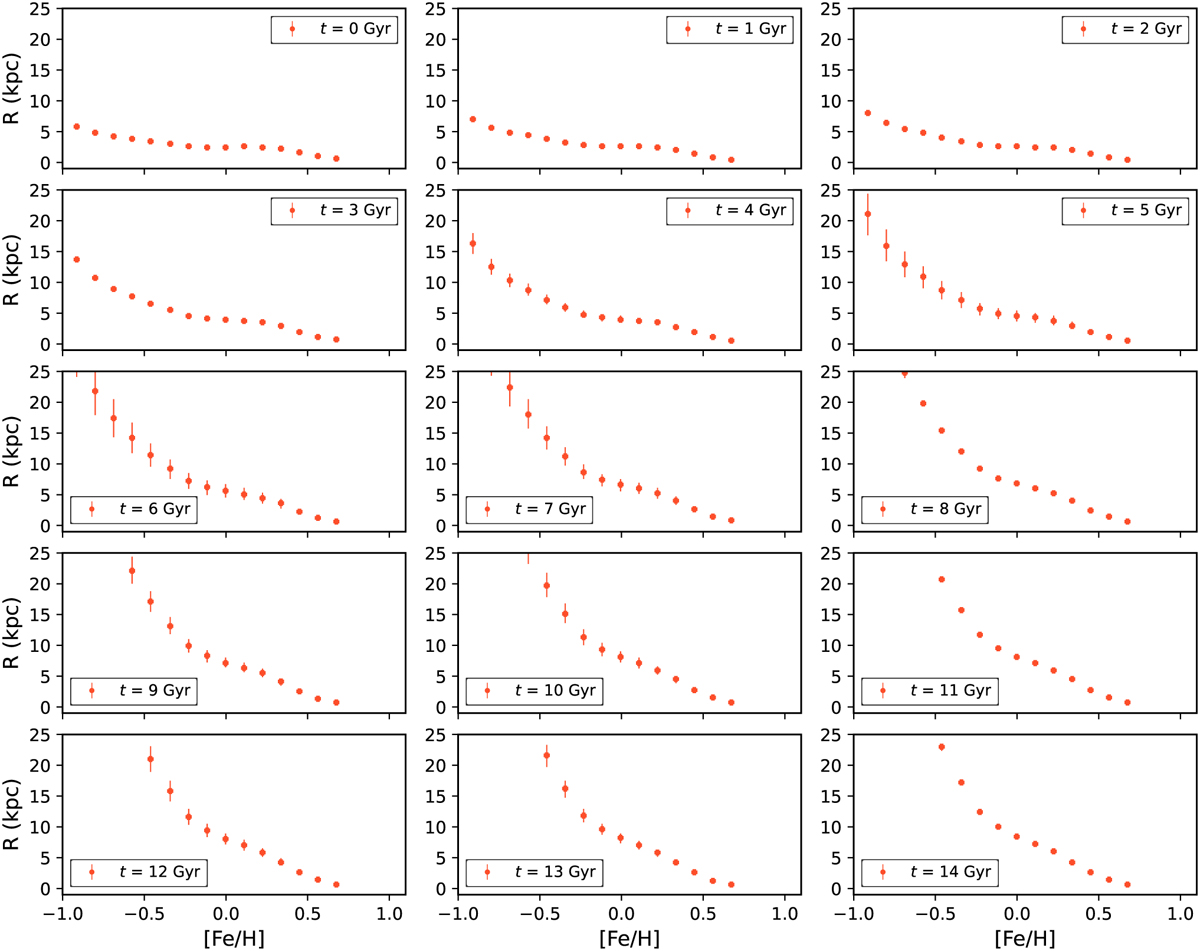
New metallicity profile grids generated using the GAM. Each curve illustrates the radial metallicity profile of stars formed at different epochs in the Universe’s history, ranging from 0 to t Gyr (age of the Universe). It is also worth mentioning that each subplot has its y-axis (R) truncated up to 25 kpc. Also, it is worth mentioning that the GAM does not limit the radii it can reach in a regression. Therefore, we chose to display up to physically meaningful radii.
Current usage metrics show cumulative count of Article Views (full-text article views including HTML views, PDF and ePub downloads, according to the available data) and Abstracts Views on Vision4Press platform.
Data correspond to usage on the plateform after 2015. The current usage metrics is available 48-96 hours after online publication and is updated daily on week days.
Initial download of the metrics may take a while.