Open Access
Fig. 5
Download original image
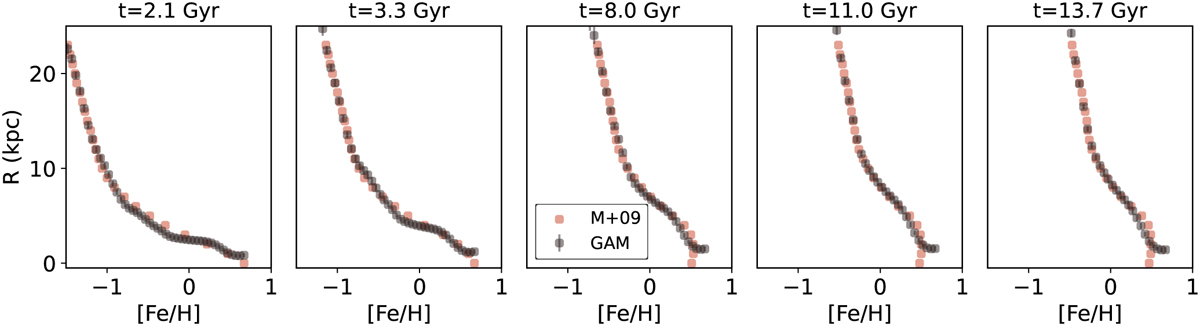
Comparison between the original theoretical models and the GAM estimated curves for the same t bins used as the GAM input (namely 2.1, 3.3, 8.0, 11.0, and 13.7 Gyr, respectively). The original models are depicted by the orange markers, whereas the new estimated GAM curves are represented by the black markers.
Current usage metrics show cumulative count of Article Views (full-text article views including HTML views, PDF and ePub downloads, according to the available data) and Abstracts Views on Vision4Press platform.
Data correspond to usage on the plateform after 2015. The current usage metrics is available 48-96 hours after online publication and is updated daily on week days.
Initial download of the metrics may take a while.