Fig. 4
Download original image
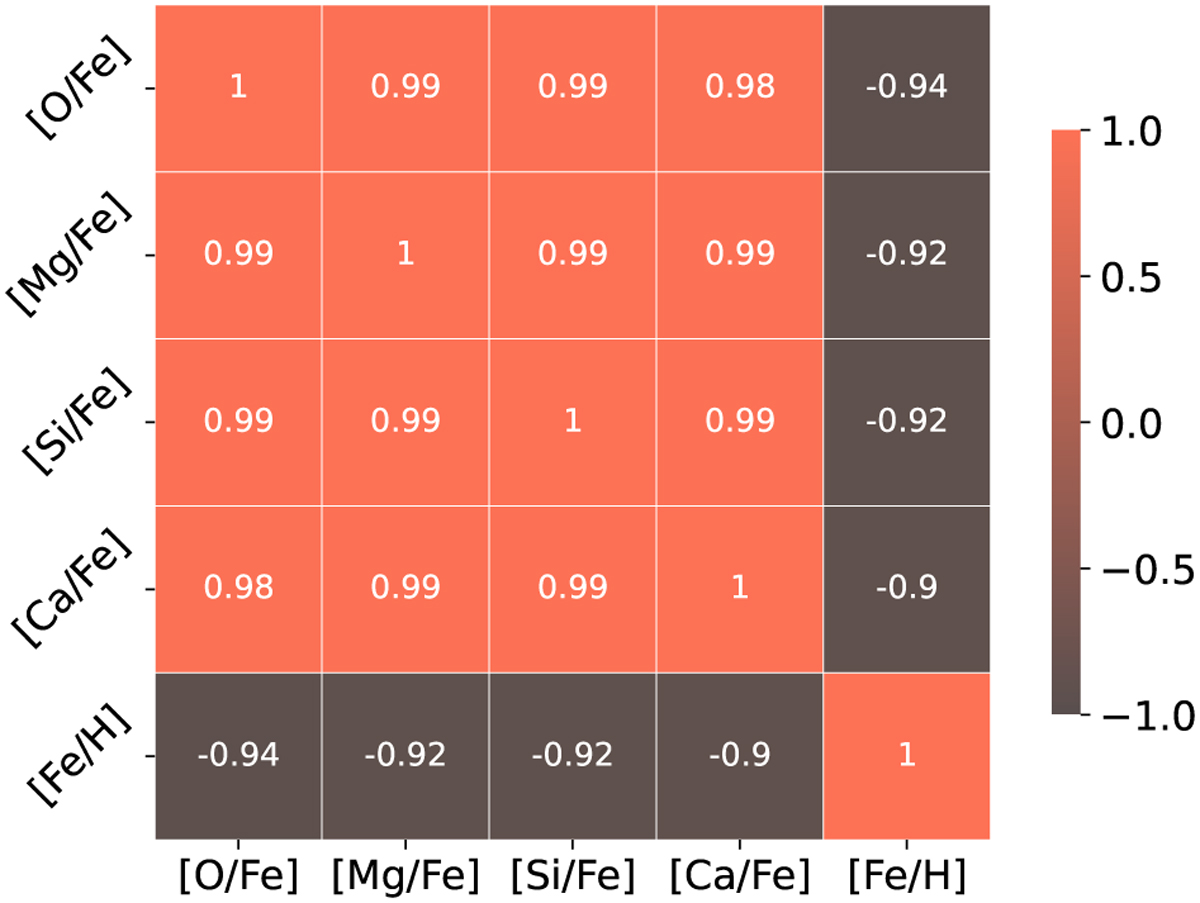
Heatmap visualisation of the correlation matrix showing the pairwise correlation coefficients between elemental abundances relative to iron ([O/Fe], [Mg/Fe], [Si/Fe], [Ca/Fe]) and the iron abundance relative to hydrogen ([Fe/H]). Orange indicates a strong positive correlation, while brown signifies a strong negative correlation, demonstrating the tight coupling between these elemental abundances in the context of Magrini et al. (2009)’s model. The correlation matrix was estimated via Spearman’s rank correlation coefficient (Spearman 1904).
Current usage metrics show cumulative count of Article Views (full-text article views including HTML views, PDF and ePub downloads, according to the available data) and Abstracts Views on Vision4Press platform.
Data correspond to usage on the plateform after 2015. The current usage metrics is available 48-96 hours after online publication and is updated daily on week days.
Initial download of the metrics may take a while.