Fig. C.4
Download original image
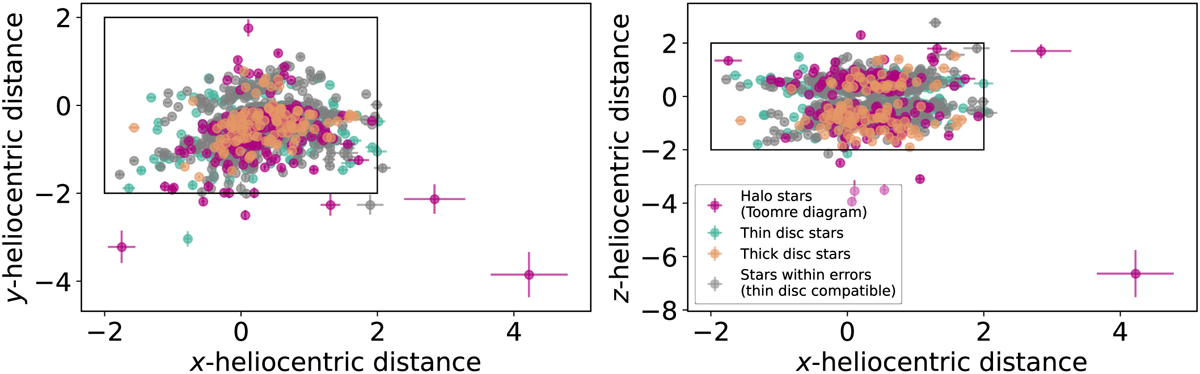
Heliocentric distance projections for the stars of our sample. This figure features two panels depicting the spatial distribution of stars within our observational sample in relation to the Sun. The left panel shows the projection onto the xy Cartesian plane and the right panel onto the xz plane. Distances are measured in kpc. Highlighted in each panel is a 2 kpc square, illustrating the region where the vast majority (> 99%) of our disc stars are located, effectively encompassed within a 2 kpc cube. Stars are coloured according to their classes described in Sect. 3.1.1 and 3.1.2.
Current usage metrics show cumulative count of Article Views (full-text article views including HTML views, PDF and ePub downloads, according to the available data) and Abstracts Views on Vision4Press platform.
Data correspond to usage on the plateform after 2015. The current usage metrics is available 48-96 hours after online publication and is updated daily on week days.
Initial download of the metrics may take a while.