Fig. C.3
Download original image
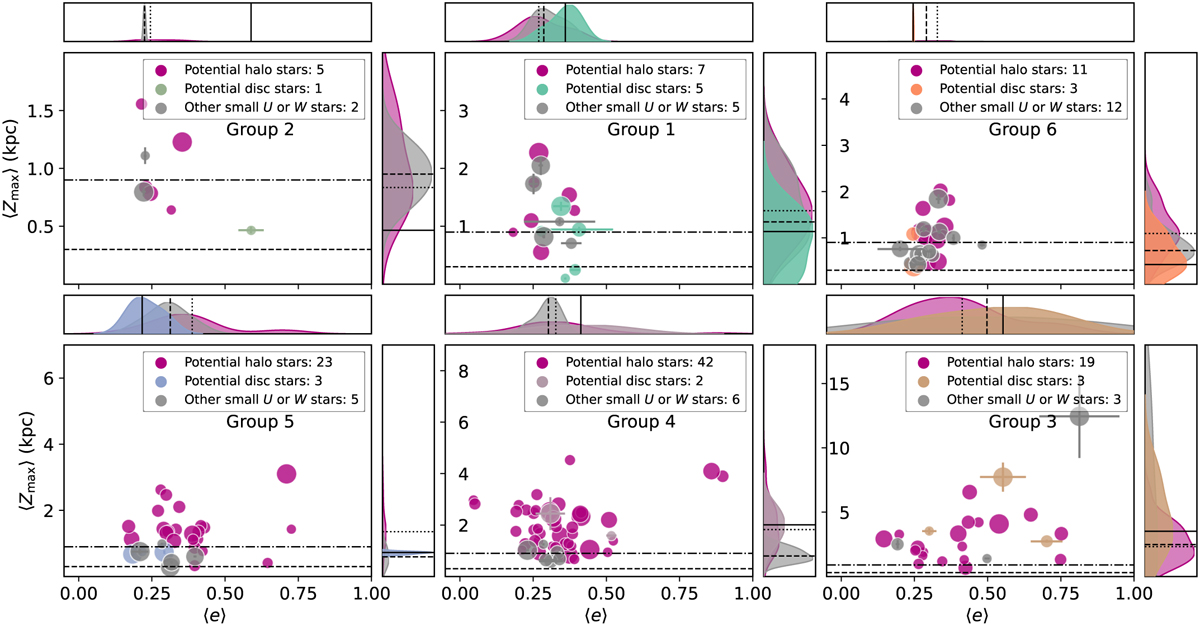
The 〈Zmax〉 and 〈e〉 of the stars removed from the main analysis using the Toomre diagram are shown here. Stars classified as most likely belonging to the Galactic halo are coloured magenta, consistent with previous figures, while stars coloured according to the sample groups represent potential blurred disc stars. The marker size is proportional to |△R|. The adjacent plots display the distributions of 〈Zmax〉 and 〈e〉, with median values indicated by a dotted line for potential halo stars, a solid line for potential disc stars, and the dashed line for stars with low W or U. As in Fig. 15, the scale heights for the thin and thick discs are shown as dotted and dot-dashed lines, respectively (i.e. 300 and 900 pc; McMillan 2017). We note that while the x-axis is the same across all subplots, the y-axis scales differ to better depict the distribution of each subplot individually. Unlike similar figures, we omit the annotated medians in the adjacent distribution plots to avoid information overload.
Current usage metrics show cumulative count of Article Views (full-text article views including HTML views, PDF and ePub downloads, according to the available data) and Abstracts Views on Vision4Press platform.
Data correspond to usage on the plateform after 2015. The current usage metrics is available 48-96 hours after online publication and is updated daily on week days.
Initial download of the metrics may take a while.