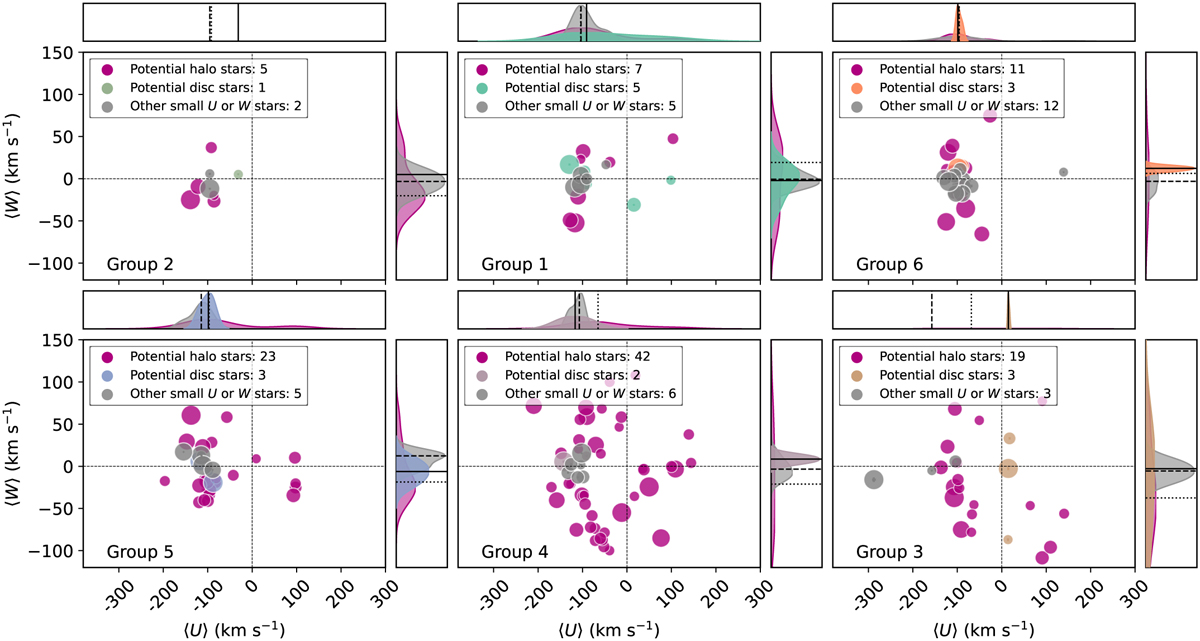
Fig. C.2
Download original image
W and U velocities of the stars removed from the main analysis using the Toomre diagram. Stars classified as most likely belonging to the Galactic halo are coloured in magenta, in accordance with previous figures, while those coloured according to the sample groups are potential blurred disc stars. The marker size is proportional to |△R|. The adjacent plots show the distribution of both velocities, with median values indicated by the dotted line for potential halo stars, the solid line for potential blurred disc stars, and the dashed line for stars with low W or U. Vertical and horizontal dashed lines at zero velocity provide visual reference points for the reader. Unlike similar figures, we omit the annotated medians in the adjacent distribution plots to avoid information overload.
Current usage metrics show cumulative count of Article Views (full-text article views including HTML views, PDF and ePub downloads, according to the available data) and Abstracts Views on Vision4Press platform.
Data correspond to usage on the plateform after 2015. The current usage metrics is available 48-96 hours after online publication and is updated daily on week days.
Initial download of the metrics may take a while.