Fig. 2
Download original image
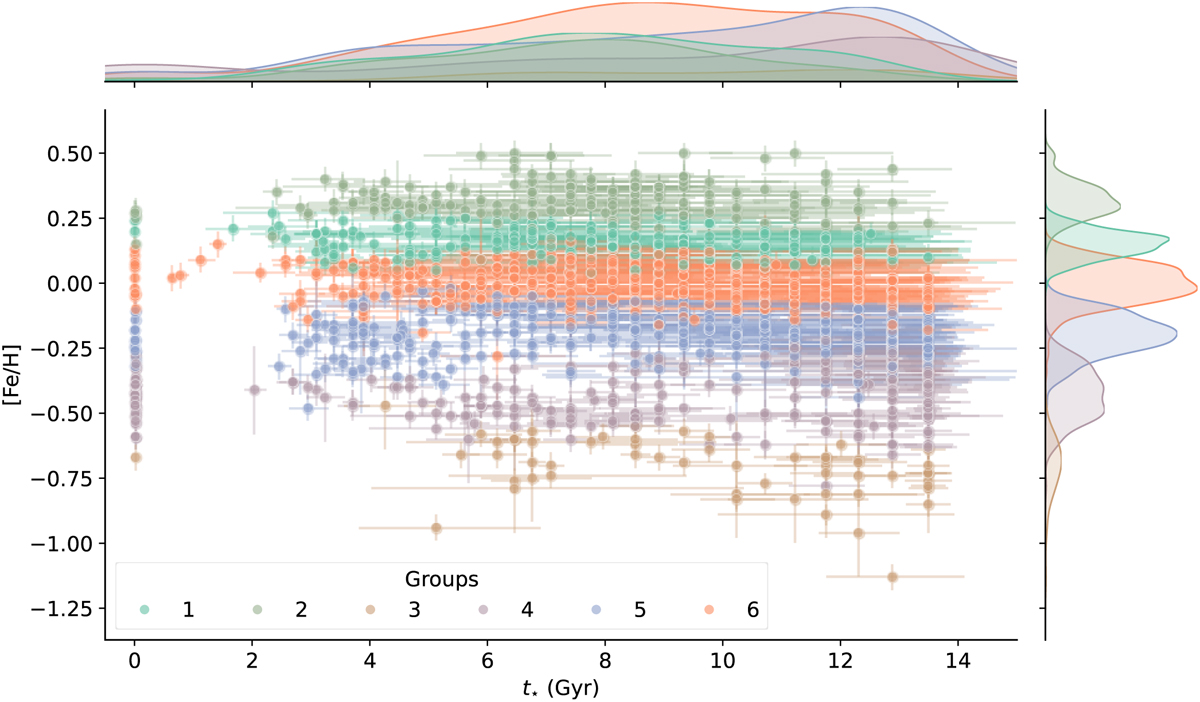
Scatter plot displaying the relationship between metallicity, [Fe/H], and stellar ages, t★, using UNIDAM estimates for the entire sample. Data points are categorised by HC groups. On top, 1D-Gaussian kernel densities show age distribution; on the right, a similar view presents [Fe/H] distribution for each HC group. The window width for the kernel density estimation is computed using Scott’s method, with a default bandwidth adjustment of 1, which is the standard configuration of the SEABORN package in PYTHON (Waskom 2021); this configuration is consistently applied to all figures with Gaussian kernel densities throughout this paper. The data points and densities are colour-coded and stratified according to the different HC groups, similarly to Fig. 1.
Current usage metrics show cumulative count of Article Views (full-text article views including HTML views, PDF and ePub downloads, according to the available data) and Abstracts Views on Vision4Press platform.
Data correspond to usage on the plateform after 2015. The current usage metrics is available 48-96 hours after online publication and is updated daily on week days.
Initial download of the metrics may take a while.