Fig. 17
Download original image
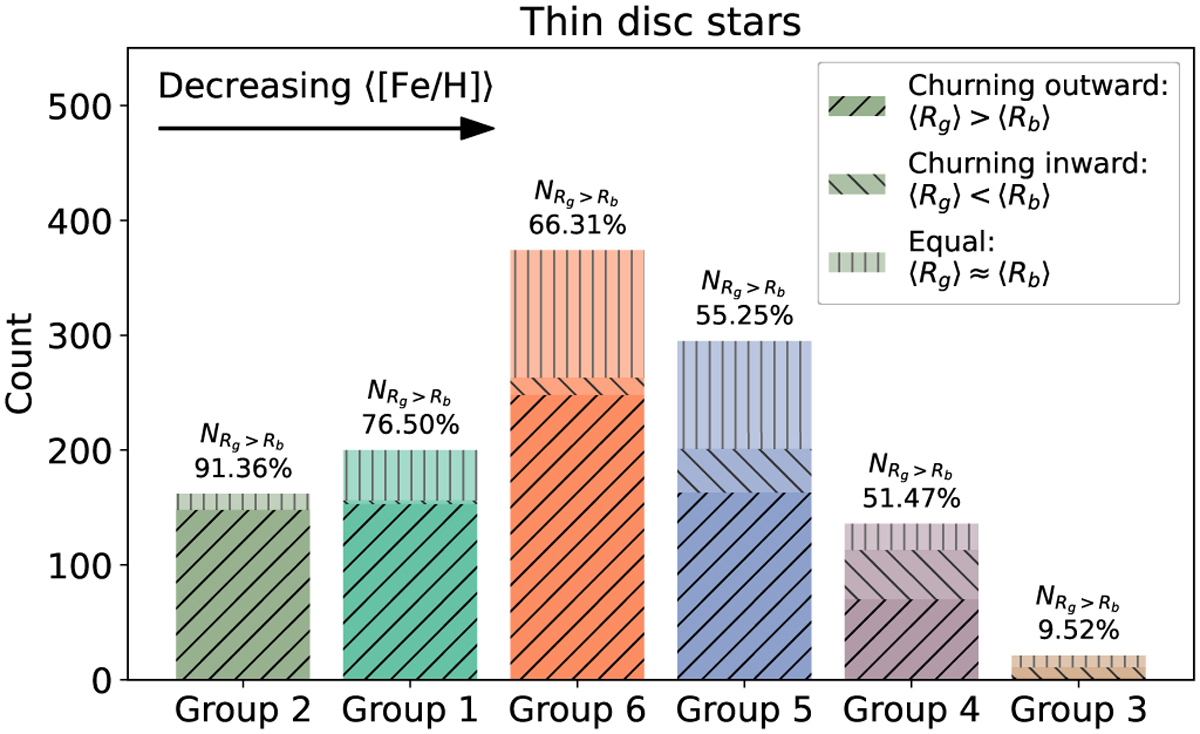
Stacked barplot showing the distribution of stars based on the comparison between their current median guiding radius (〈Rg〉) and birth radius (〈Rb〉) across various stellar groups, arranged in order of decreasing 〈[Fe/H]〉. The lower segments of the bars, shown in darker shades with right-slanted hatching, represent stars with 〈Rg〉 greater than 〈Rb〉. The middle segments, in medium shades with left-slanted hatching, indicate stars where 〈Rb〉 is less than 〈Rg〉. The top segments, in the lightest shades with vertical hatching, represent stars for which 〈Rg〉 and 〈Rb〉 are consistent within the adopted 2σtot threshold. Each group is uniquely coloured according to the scheme used consistently throughout the paper for clarity. Additionally, the percentage of stars with 〈Rg〉 > 〈Rb〉 is displayed at the top of each bar.
Current usage metrics show cumulative count of Article Views (full-text article views including HTML views, PDF and ePub downloads, according to the available data) and Abstracts Views on Vision4Press platform.
Data correspond to usage on the plateform after 2015. The current usage metrics is available 48-96 hours after online publication and is updated daily on week days.
Initial download of the metrics may take a while.