Fig. 15
Download original image
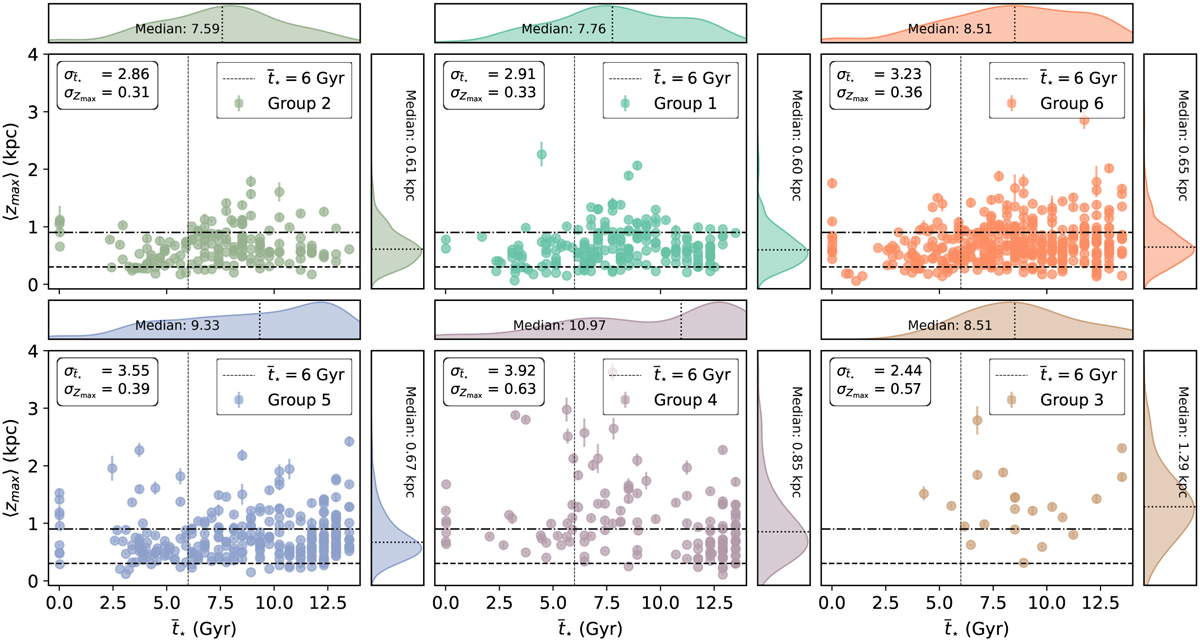
Median maximum Galactic height, 〈Zmax〉, versus the median stellar age, t★, for all disc stars in the six groups, ordered by decreasing metallicity from top left to bottom right. This image is similar to Fig. 14, with adjacent 1D-Gaussian kernel distributions helping the visualisation of the distribution of both parameters and horizontal lines indicating the scale heights for the thin and thick discs (dashed and dot-dashed lines respectively). A vertical line is added at t = 6 Gyr to flag the time of the first pericentric passage of Sagittarius. Age uncertainties are not displayed to improve visualisation, but typical errors are of 2 Gyr (Mints & Hekker 2018). It is noticeable the increase in the proportion of stars with larger 〈Zmax〉 with decreasing metallicities (i.e. groups 5, 4, and 3), and thus we have included the standard deviation of both parameters (![]() and σZmax) for each group in the top left corner. Both standard deviations tend to increase as 〈[Fe/H]〉 decreases.
and σZmax) for each group in the top left corner. Both standard deviations tend to increase as 〈[Fe/H]〉 decreases.
Current usage metrics show cumulative count of Article Views (full-text article views including HTML views, PDF and ePub downloads, according to the available data) and Abstracts Views on Vision4Press platform.
Data correspond to usage on the plateform after 2015. The current usage metrics is available 48-96 hours after online publication and is updated daily on week days.
Initial download of the metrics may take a while.