Fig. 14
Download original image
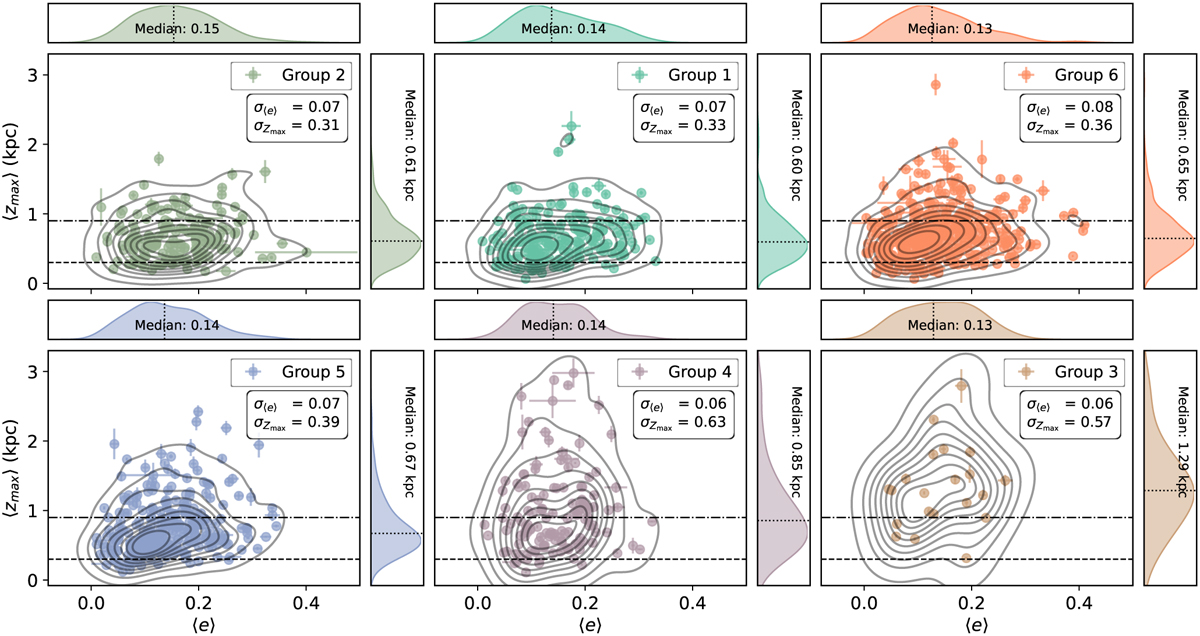
Median maximum Galactic azimuthal height, 〈Zmax〉, versus the median eccentricity, 〈e〉, for all disc stars in the six groups, ordered by decreasing metallicity from top left to bottom right. The 1D-Gaussian kernel density distributions for 〈Zmax〉 and 〈e〉 are shown adjacent to the main subplots, with medians marked by dotted lines and annotated values. The main subplots display all disc stars, with thin (300 pc) and thick disc (900 pc) scale heights (McMillan 2017) marked by dashed and dot-dashed lines, respectively, and a 2D Gaussian kernel density plot indicating higher density regions. Consistent x- and y-axis ranges highlight the shift in distributions across metallicity groups, with the proportion of stars with larger 〈Zmax〉 increasing as metallicity decreases.
Current usage metrics show cumulative count of Article Views (full-text article views including HTML views, PDF and ePub downloads, according to the available data) and Abstracts Views on Vision4Press platform.
Data correspond to usage on the plateform after 2015. The current usage metrics is available 48-96 hours after online publication and is updated daily on week days.
Initial download of the metrics may take a while.