Fig. 13
Download original image
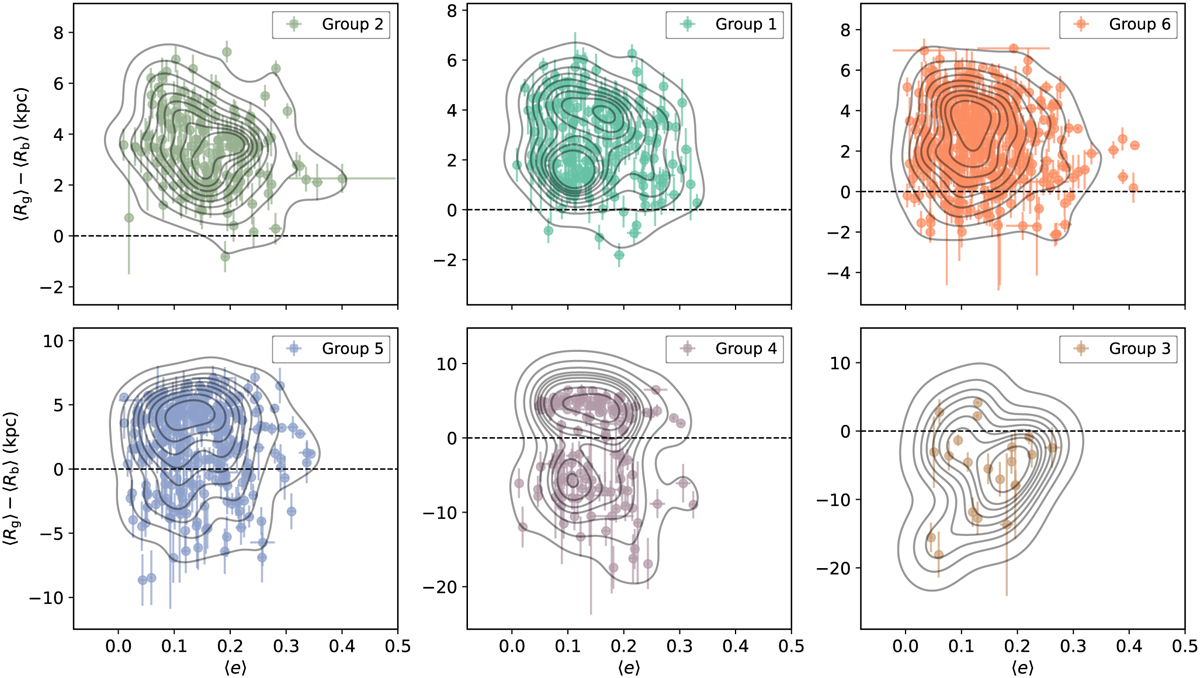
Variation of Galactocentric distance versus median eccentricity (〈Rg〉-〈Rb〉 × 〈e〉) across stellar groups, arranged in descending order of median metallicity 〈[Fe/H]〉. The range of eccentricity (〈e〉) on the x-axis remains consistent across all subplots, while the y-axis retains an unconstrained scale, enhancing the visualisation of the pronounced 〈Rg〉-〈Rb〉 dispersion. Corresponding to Fig. 12, a horizontal dashed line is positioned at 〈Rg〉-〈Rb〉 = 0 to accentuate the region where Galactocentric distances coincide. To illuminate the 2D distribution of stars within the designated parameter space, 2D-Gaussian kernel densities are overlaid upon the scatter markers. Consistent with prior visuals, the colours in this figure maintain the same scheme.
Current usage metrics show cumulative count of Article Views (full-text article views including HTML views, PDF and ePub downloads, according to the available data) and Abstracts Views on Vision4Press platform.
Data correspond to usage on the plateform after 2015. The current usage metrics is available 48-96 hours after online publication and is updated daily on week days.
Initial download of the metrics may take a while.