Fig. 12
Download original image
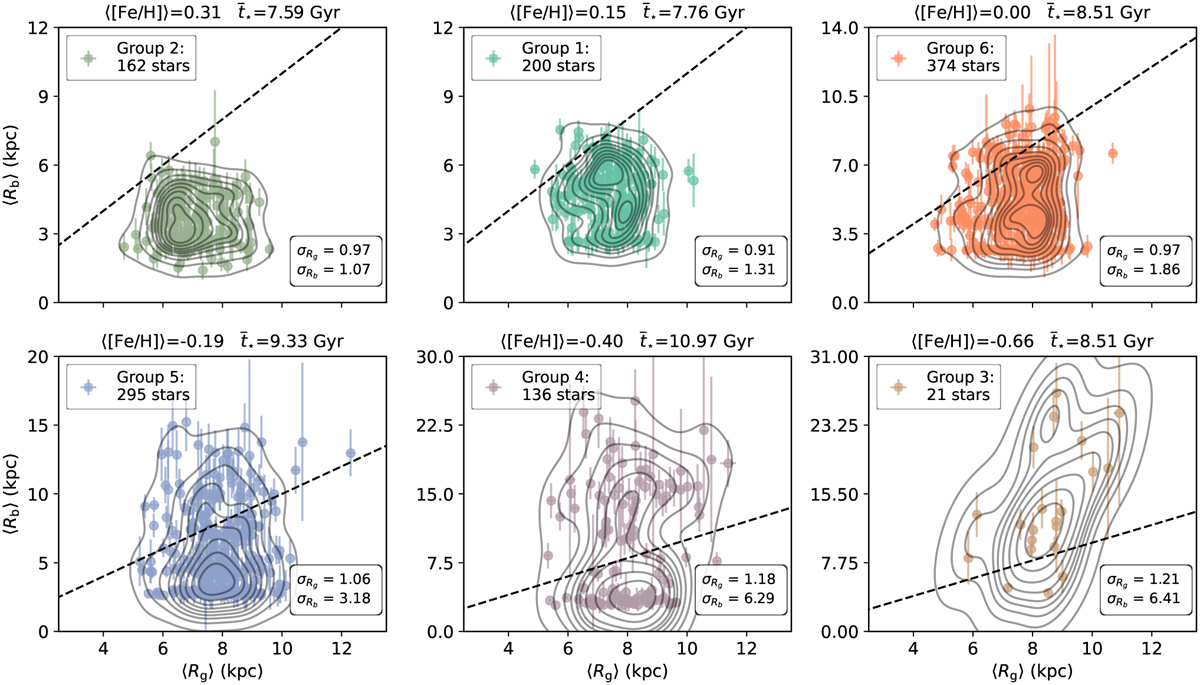
Estimated Galactocentric birth radii, 〈Rb〉, in contrast to the present guiding radii, 〈Rg〉. Both radii are measured in kiloparsecs and encompass all stars in our sample that are part of the disc, according to Fig. 7. Each distinct subplot delineates a specific star group, classified using hierarchical clustering (as illustrated in Fig. 1). The subplots are arranged in descending order of the median iron abundance, 〈[Fe/H]〉. At the upper part of each subplot, 〈[Fe/H]〉 and ![]() are displayed. Furthermore, the overall standard deviations (σ) for 〈Rb〉 and 〈Rg〉 are exhibited at the lower right corner of each subplot. We overlay the 2D-Gaussian kernel densities to illustrate the concentration patterns of the stars in each subplot. A reference black dashed line is incorporated, signifying the point of parity between both radii (〈Rb〉 = 〈Rg〉). The colour scheme remains consistent with the preceding figures.
are displayed. Furthermore, the overall standard deviations (σ) for 〈Rb〉 and 〈Rg〉 are exhibited at the lower right corner of each subplot. We overlay the 2D-Gaussian kernel densities to illustrate the concentration patterns of the stars in each subplot. A reference black dashed line is incorporated, signifying the point of parity between both radii (〈Rb〉 = 〈Rg〉). The colour scheme remains consistent with the preceding figures.
Current usage metrics show cumulative count of Article Views (full-text article views including HTML views, PDF and ePub downloads, according to the available data) and Abstracts Views on Vision4Press platform.
Data correspond to usage on the plateform after 2015. The current usage metrics is available 48-96 hours after online publication and is updated daily on week days.
Initial download of the metrics may take a while.