Fig. 11
Download original image
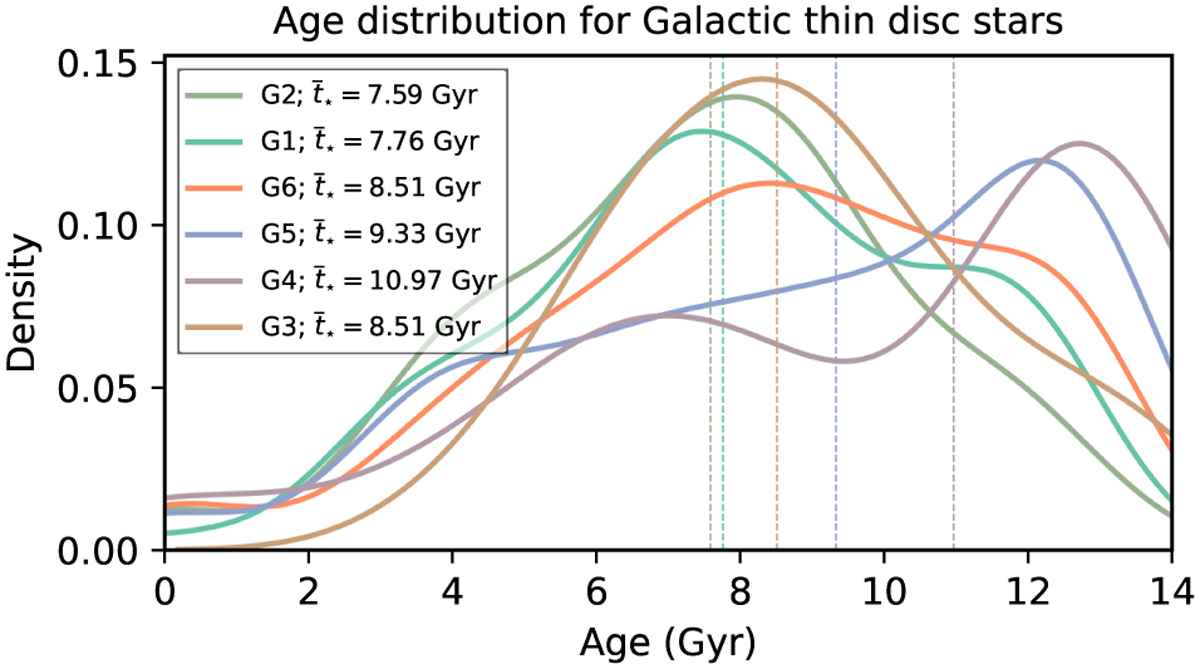
Age distribution for the stars belonging to the Galactic disc illustrated in the shape of Gaussian kernel densities for easier view (instead of histograms). The x-axis has been truncated to represent a physically meaningful range of stellar ages. The vertical dashed lines in corresponding colours show the computed median ages for each subgroup in our disc stellar sample. The colour scheme is consistent with the preceding figures.
Current usage metrics show cumulative count of Article Views (full-text article views including HTML views, PDF and ePub downloads, according to the available data) and Abstracts Views on Vision4Press platform.
Data correspond to usage on the plateform after 2015. The current usage metrics is available 48-96 hours after online publication and is updated daily on week days.
Initial download of the metrics may take a while.