Fig. 1
Download original image
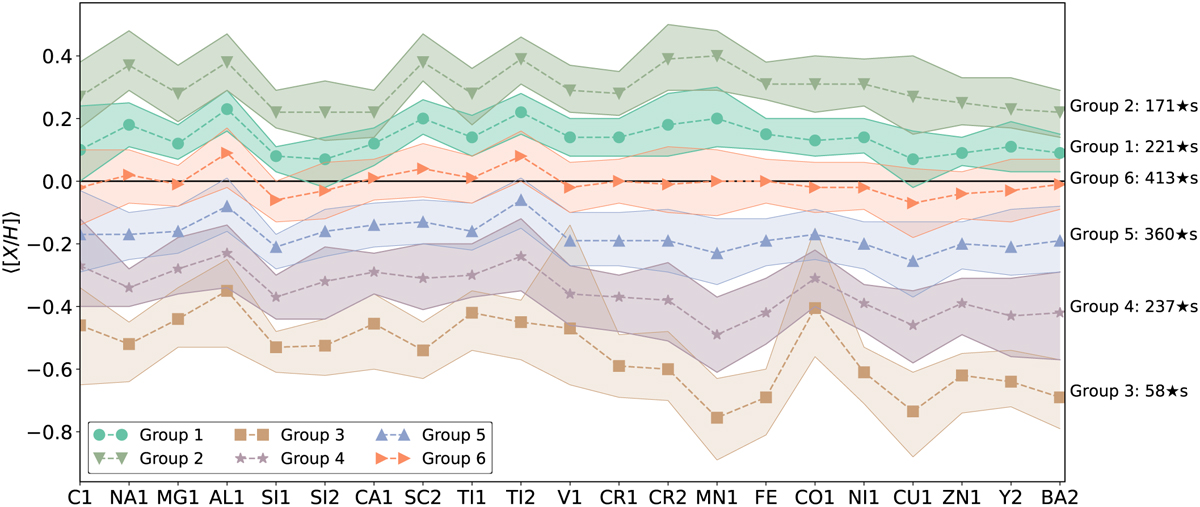
Chemical abundances, arranged in ascending order of atomic number (x-axis), of the six main stellar groups (y-axis; in terms of solar abundance) classified using an HC algorithm. On the right side of the figure, each group is labelled with its corresponding number, along with the total count of stars in each group. 〈[X/H]〉 = 0 is depicted by the black horizontal to represent the solar abundances. It is important to note that the lines in the image are not indicative of regression but are rather utilised to visually represent the relative increase or decrease in element abundance compared to the preceding element. The shaded areas depict the 1σ (16–84%) confidence interval after bootstrapping the data of each group.
Current usage metrics show cumulative count of Article Views (full-text article views including HTML views, PDF and ePub downloads, according to the available data) and Abstracts Views on Vision4Press platform.
Data correspond to usage on the plateform after 2015. The current usage metrics is available 48-96 hours after online publication and is updated daily on week days.
Initial download of the metrics may take a while.