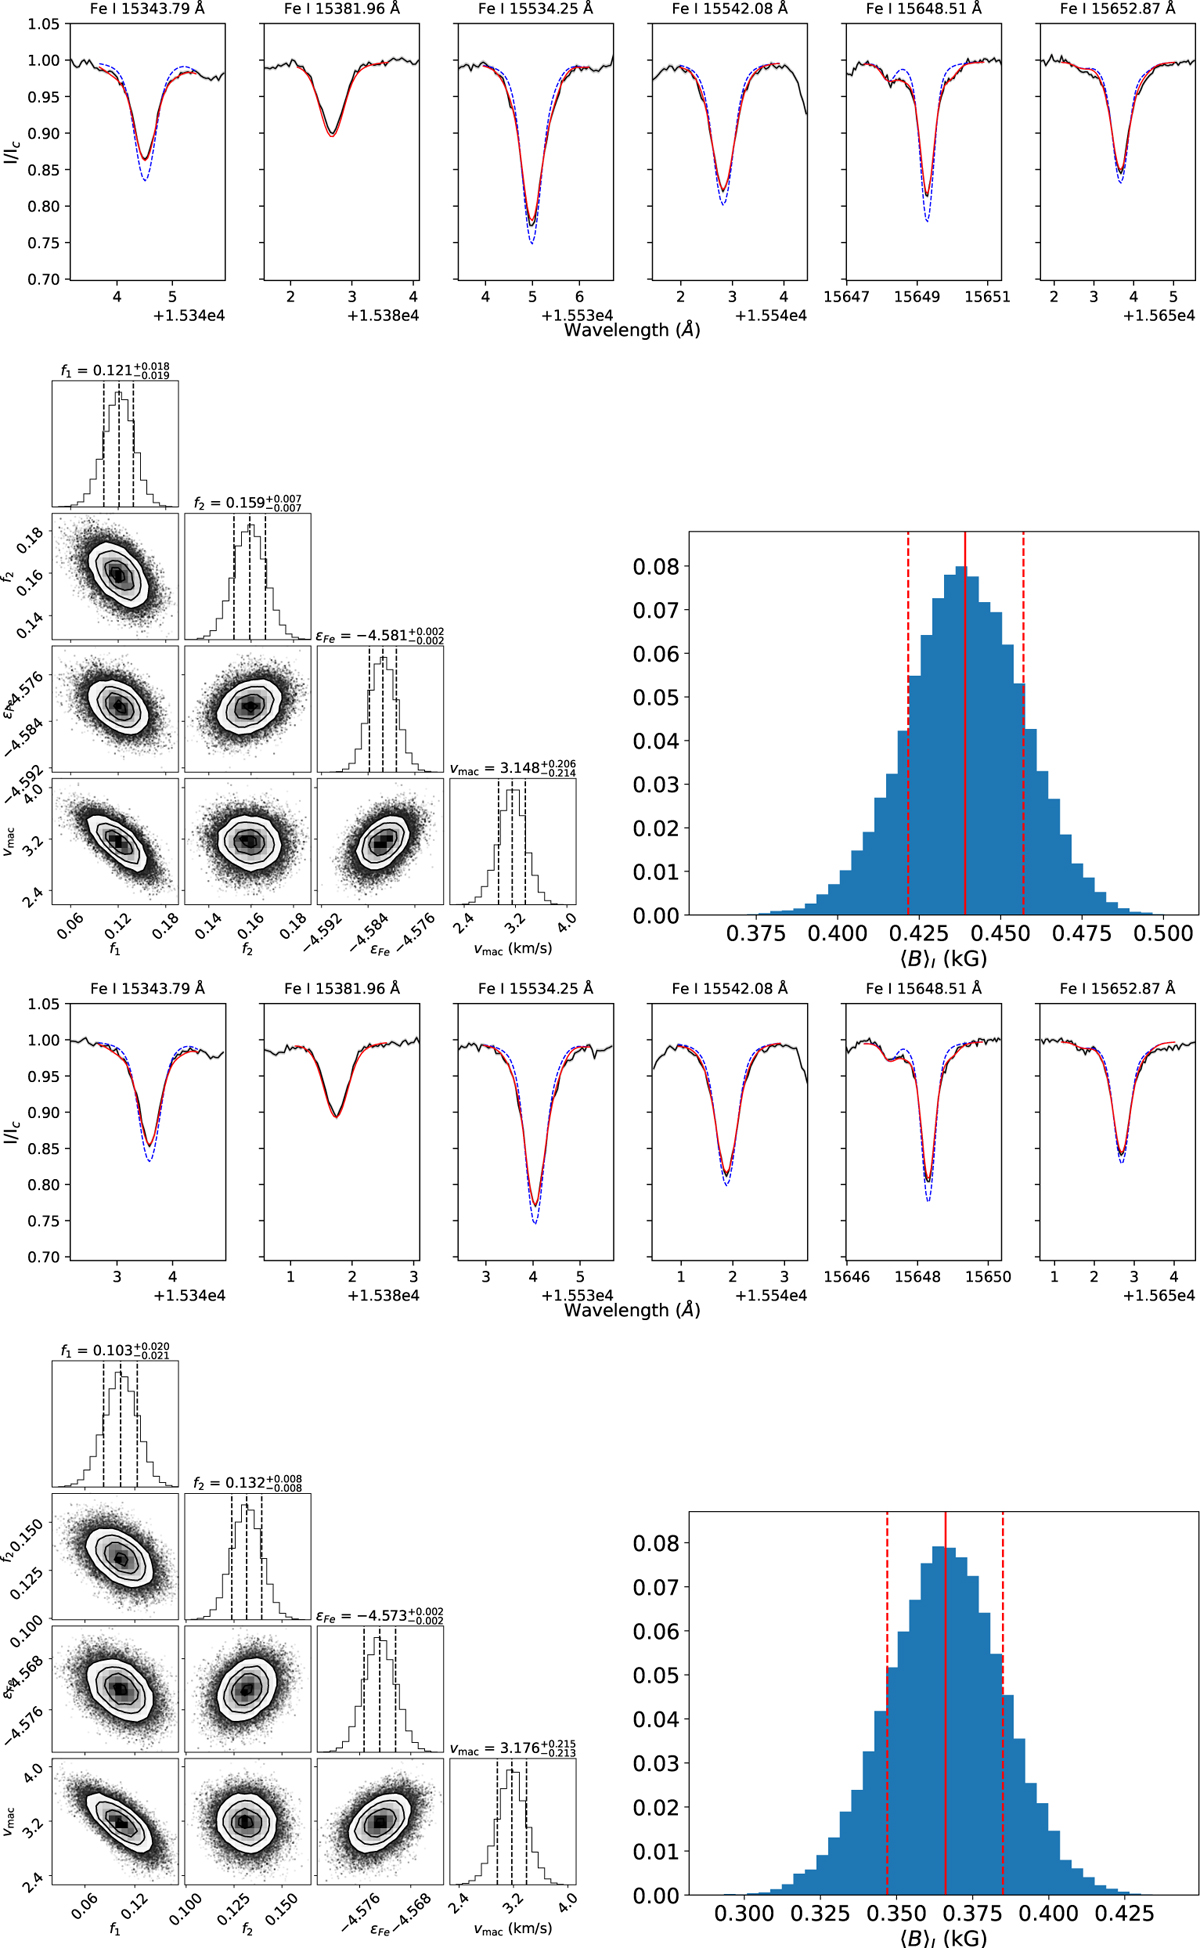
Fig. D.2
Download original image
Upper panel. Observation from May 25, 2023. Lower panel. Observation from April 9, 2024. Top. Best fit synthetic spectra (red) for the H-band observations (black) including the non-magnetic synthetic spectra (dashed-blue). Bottom. Posterior distributions of the inference parameters (left) and average surface magnetic field strength (right) for the same observation. Vertical lines are showing the median and 68% credence regions in the same way as in Fig. 2.
Current usage metrics show cumulative count of Article Views (full-text article views including HTML views, PDF and ePub downloads, according to the available data) and Abstracts Views on Vision4Press platform.
Data correspond to usage on the plateform after 2015. The current usage metrics is available 48-96 hours after online publication and is updated daily on week days.
Initial download of the metrics may take a while.